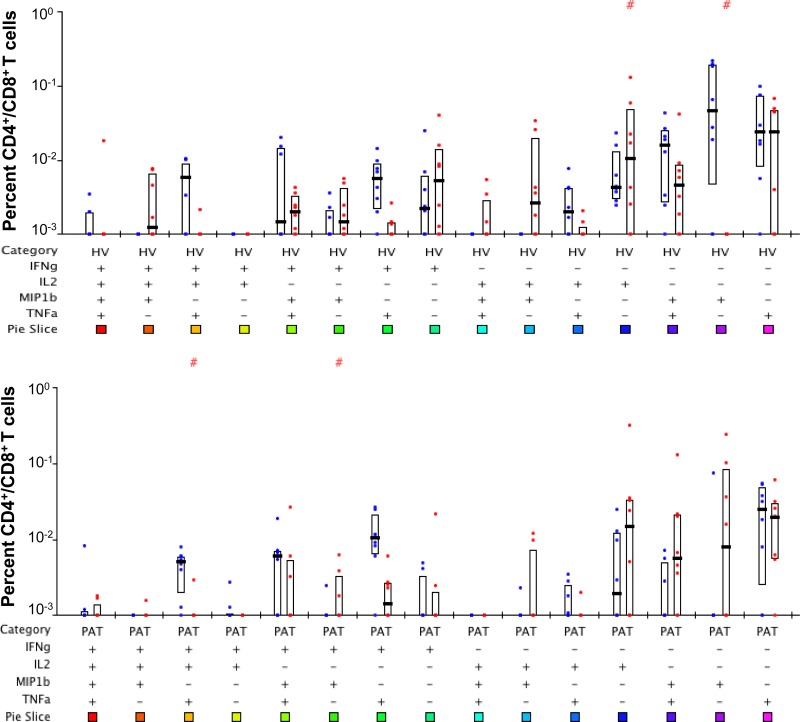
FIG 5.
Polyfunctional human T cell response to secreted antigen ESAT-6. The plots show comparisons of frequencies of CD4+ (left bar in each pair) with CD8+ (right bar in each pair) T cells in latently infected HV (top panel) and PAT (bottom panel) secreting different combinations of the cytokines IFN-γ, IL-2, TNF-α, and MIP-1β indicated below the pairs of bars as + or −. #P values for significant differences between HV and PAT computed by the nonparametric Wilcoxon test available within SPICE. None of the values were significant following Bonferroni's correction for multiple comparisons.

