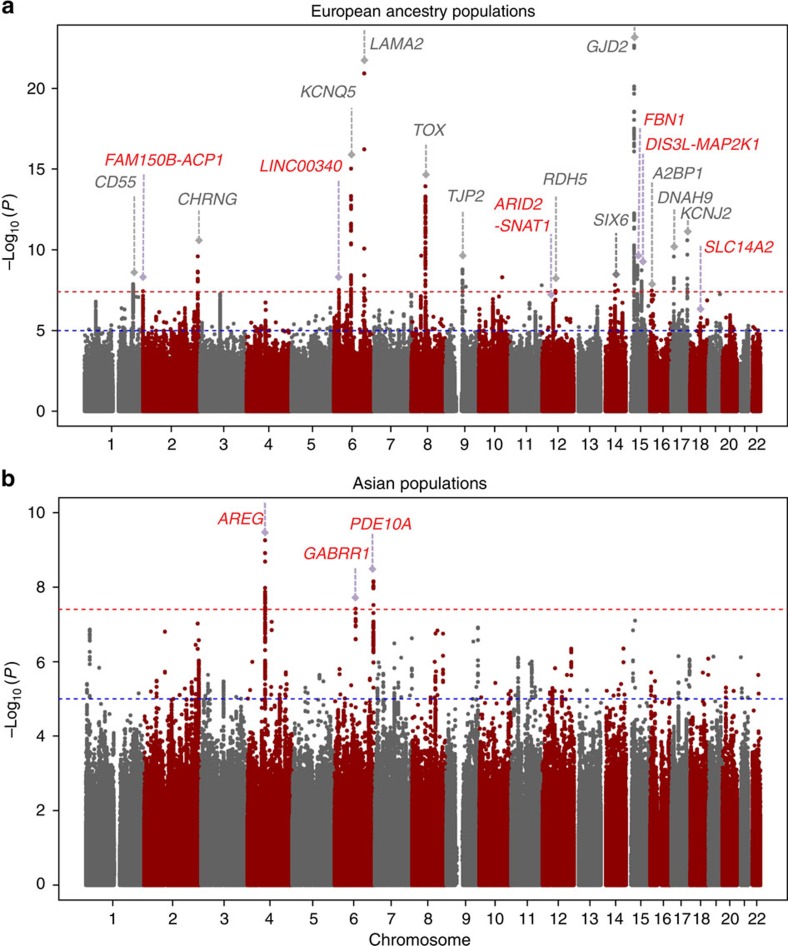
Figure 2. Manhattan plots of −log10(P) for the JMA on SNP main effects and SNP × education effects on spherical equivalent in (a) European ancestry populations and (b) Asian populations.
The horizontal red line indicates the genome-wide significance level of PJMA<5 × 10⁻⁸. The horizontal blue line indicates the suggestive significance level of PJMA<1 × 10⁻⁵. Novel loci reaching genome-wide significance are labelled in red and known loci are in grey.

