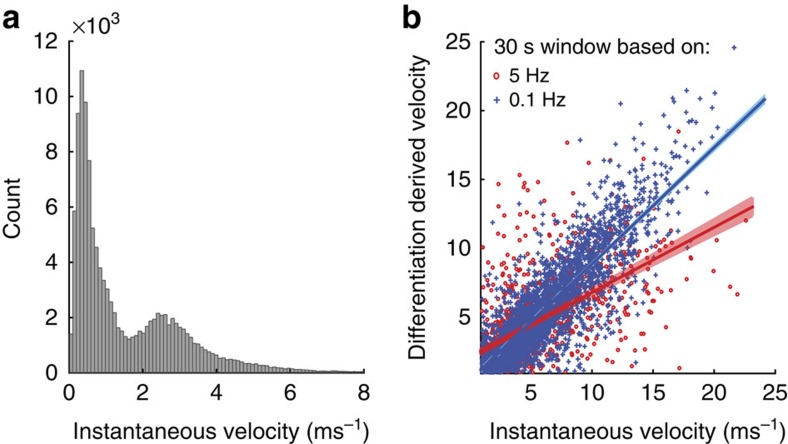
Figure 4. Preferred speed and tortuosity estimates based on instantaneous velocity measures.
(a) Histogram of instantaneous velocity measures during the daily 2 h of 10 s GPS fixes. (b) Differentiation derived velocity versus instantaneous velocity for walking and trotting (10 s GPS fixes, blue, slope 0.84) and running (5 Hz, red, slope 0.47), averaged for 30 s windows. The lower ratio of differentiated to instantaneous velocity for running (5 Hz) shows the higher tortuosity during chases.

