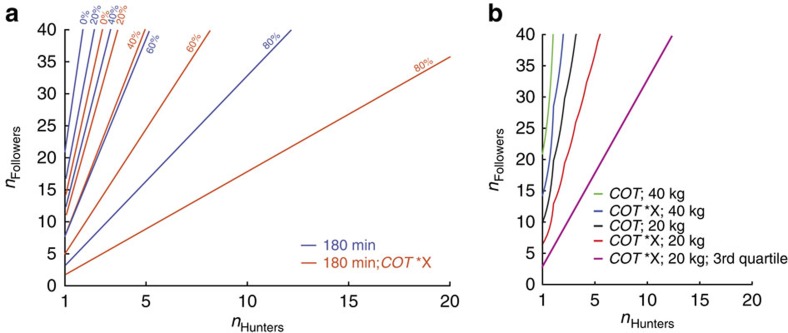
Figure 9. Influence of different model parameters on model outcome.
(a) Effect of kleptoparasitism and COT error analysis. Boundary on sustainable pack composition assuming a 180 min limit on daily hunting time. Red lines indicate boundary (pack composition to the right of the line is sustainable) for different percentages of prey stolen (40 kg, impala). Blue lines indicate sustainability for higher COT (COTLow × 2.5; COTHigh × 1.5) based on ref. 47. (b) Sustainability boundary for 180 min daily hunting time limit calculated for different COT47, prey size and abundance. Lower prey density simulated using the 3rd quartile for hunt distance (3.38 km) and hunt duration (45.3 min).

