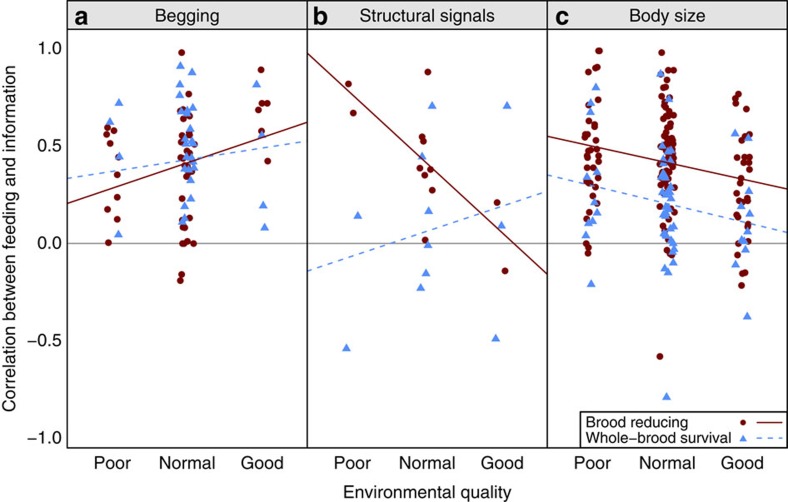
Figure 5. Brood reduction likelihood determines how parents respond to chick signals and cues.
Data points represent species' mean correlation coefficient (effect size) of signal intensity or body size on food allocation in that environment. Positive correlations indicate larger chicks or those signalling more intensely receive more food. This is a graphical simplification; analyses were run on the full data set per effect size reported, not species' means. (a) Parents respond more to begging as the environment improves (MCMCglmm, pMCMC=0.01, N=61 species). (b) Brood-reducing species paid more attention to structural signals in poorer environments, whereas species that rear the whole brood show a consistently low response, though low sample size keeps this interaction non-significant (MCMCglmm, pMCMC=0.09, N=15 species). (c) Parents showed a stronger preference for larger chicks in poorer environments (MCMCglmm, pMCMC=0.006) and brood-reducing species (MCMCglmm, pMCMC<0.0002 and N=120 species).

