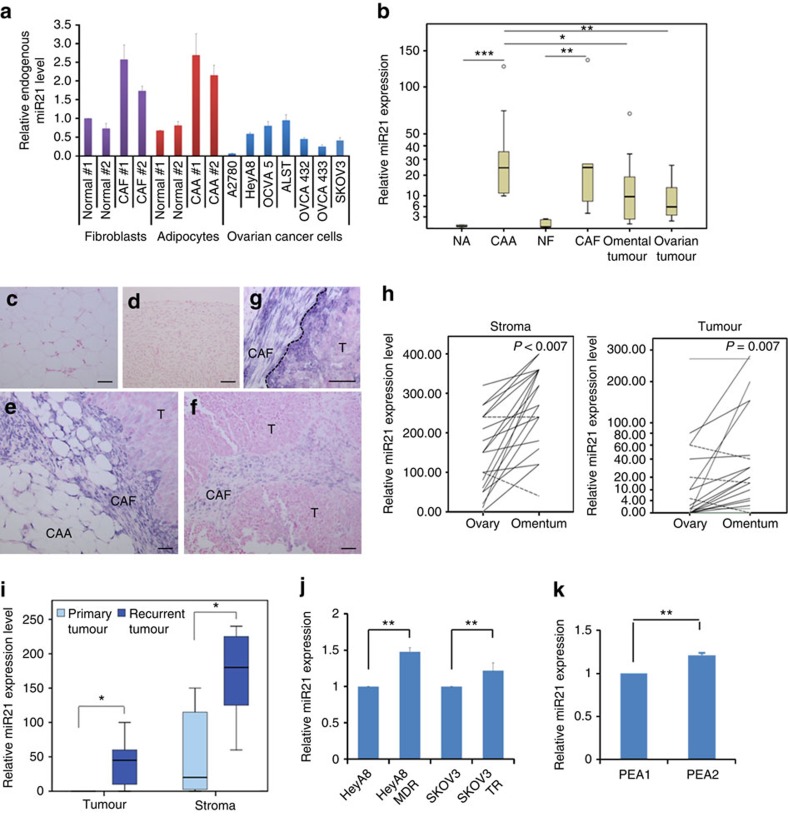
Figure 2. Differential miR21 expression in ovarian tumour tissue and cancer cell lines.
(a) qRT–PCR analysis of miR21 expression in cultured normal ovarian fibroblasts, CAFs, normal adipocytes, CAAs and ovarian cancer cell lines. (b) qRT–PCR analysis of miR21 expression in microdissected normal adipocytes (n=5), CAAs (n=9), normal fibroblasts (n=5), CAFs (n=5) and ovarian cancer cells from omental (n=10) and primary ovarian sites (n=10). ***P<0.001, **P<0.01 and *P<0.05; Mann–Whitney U-test. (c–g) In situ hybridization of miR21 in (c) normal omental adipocytes, (d) normal ovarian tissue and (e) omental and (f) primary ovarian sites of ovarian carcinoma. Strong miR21 staining in omental cancer cells was observed at the tumour–stroma interface (g; dashed line). Digoxigenin-labelled miR21 probes were detected using anti-digoxigenin-alkaline phosphatase and visualized as dark blue nitro-blue tetrazolium and 5-bromo-4-chloro-3′-indolyphosphate precipitate. Sections were counterstained with Nuclear Fast Red. CAAs, cancer-associated adipocytes; CAFs, cancer-associated fibroblasts; T, tumour. Scale bar, 50 μm. (h) Pair-wise comparisons of miR21 expression in omental and primary ovarian tumour sites from stromal (n=20; P<0.000; Wilcoxon signed-rank test) and epithelial (n=19; P=0.007; Wilcoxon signed-rank test) components of advanced-stage ovarian cancer cells. Relative miR21 expression was measured by in situ hybridization; each line represents the expression level in the same patient. The solid lines indicate higher miR21 expression in the omental site than in the primary ovarian site; the dashed lines represent lower expression in the omental site. (i) Box plot showing miR21 expression in stromal (n=14) and epithelial (n=14) components of primary and recurrent omental ovarian tumour tissue, as quantified by in situ hybridization analyses. **P<0.01; Mann–Whitney U-test. (j) qRT–PCR of miR21 expression in ovarian cancer HeyA8 and SKOV3 cells and their paclitaxel-resistant sublines HeyA8-MDR and SKOV3-TR. The results were the average from at least three separate experiments. Mean±s.d.; **P<0.01; two-tailed Student's t-test. (k) qRT–PCR of miR21 expression in the primary PEA1 tumour cells and the cell line established after cisplatin treatment (PEA2). The results were the average from at least three separate experiments. Mean±s.d.; **P<0.01; two-tailed Student's t-test.

