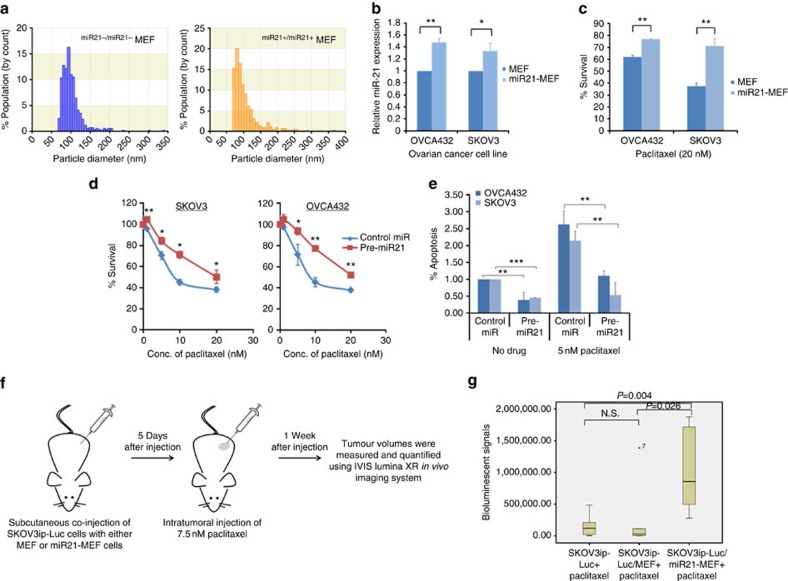
Figure 4. MiR21 enhances ovarian cancer cell chemoresistance and decreases apoptosis in ovarian cancer cells.
(a) qNano analyses of exosomes isolated from miR21−/miR21−MEFs and miR21+/miR21+MEFs. A majority of the purified exosomes were <100 nm in diameter. (b) qRT–PCR analysis showing a significant increase in miR21 in SKOV3 and OVCA432 cells treated with miR21+/miR21+MEF exosomes compared with those treated with miR21−/miR21−MEF exosomes. The results were the average from at least three independent experiments. Mean±s.d.; **P<0.01 and *P<0.05; two-tailed Student's t-test. (c) Bar charts showing a significant decrease in cell number in SKOV3 and OVCA432 cells treated with miR21−/miR21−MEF exosomes compared with those treated with miR21+/miR21+MEF exosomes in the presence of 20 nM paclitaxel. The results were the average from at least three independent experiments. Mean±s.d.; **P<0.01; two-tailed Student's t-test. Effect of miR21 overexpression on (d) paclitaxel sensitivity and (e) paclitaxel-induced apoptosis in OVCA432 and SKOV3 ovarian cancer cells. After being transfected with miR21 precursor (pre-miR21) or negative control (control miR), the cells were incubated with paclitaxel for 3 days. Cell survival and apoptosis were measured by MTT assay and Cell Death Detection ELISA, respectively. The results were the average from at least three independent experiments. Mean±s.d.; ***P<0.001, **P<0.01 and *P<0.05; two-tailed Student's t-test. (f) A schematic diagram showing the use of the in vivo model to evaluate the effects of CAFs on the paclitaxel sensitivity of cancer cells. (g) Luciferase-labelled SKOV3ip ovarian cancer cells and miR21+/miR21+MEF (miR21-MEF) or miR21−/miR21−MEF (MEF) cells, or SKOV3ip cells alone were subcutaneously injected into female BALB/c athymic nude mice, to establish tumours. The tumour volumes were measured and quantified using the IVIS-Lumina XR in vivo imaging system after a 7-day intratumoral paclitaxel treatment. A box plot showing a significant decrease in luciferase activity in the miR21-MEF group (n=6) compared with the MEF group (n=6) after paclitaxel treatment (P=0.026; Mann–Whitney U-test) or the cancer cells alone group (n=6) after paclitaxel treatment (P=0.004; Mann–Whitney U-test). NS, not significant (P>0.05; Mann–Whitney U-test).

