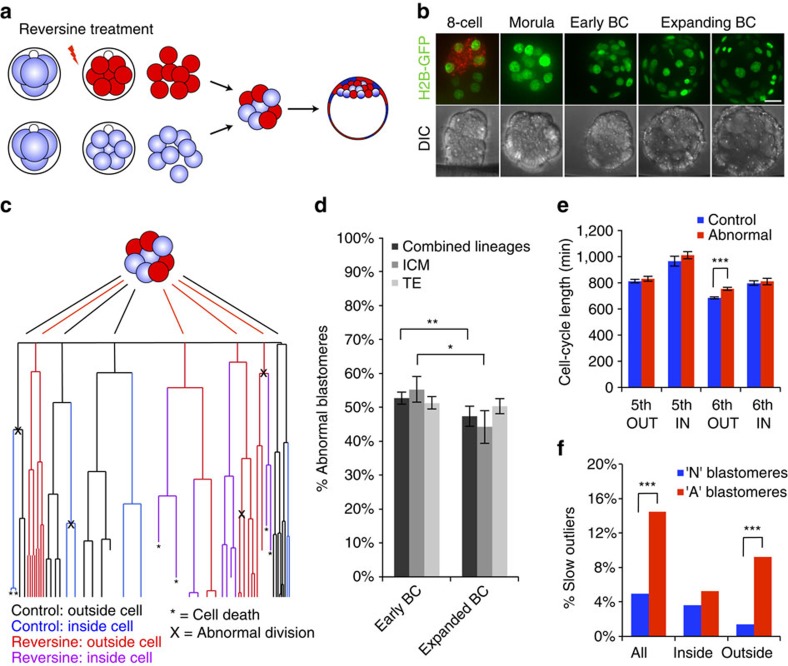
Figure 3. Pre-implantation development of chimeric mosaic embryos.
(a) Chimeras containing a 1:1 ratio of control and reversine-treated blastomeres were generated at the eight-cell stage. (b) Chimeras expressing Histone H2B-GFP (n=20) were imaged for 2 days to the late blastocyst (BC) stage and the movements and divisions of all cells were tracked (n=1,079 cells). Scale bar, 20 μm. (c) Example of lineage tree showing the fate of control and reversine-treated blastomeres in a chimeric embryo. Cell tracking data are provided in Supplementary Data 2. (d) The number of abnormal cells decreases in the ICM during blastocyst expansion (*P<0.05 and **P<0.01; Student's t-test). (e) Average lengths of the fifth and sixth cell cycles for control and abnormal cells in inside and outside positions. Outside cells have a significantly longer sixth cell cycle than controls (***P<0.001; Student's t-test). (f) The proportion of slow outliers is greatly increased in the outside cells of the abnormal clone, compared with controls (***P<0.001, χ2-test). Error bars represent s.e.m.

