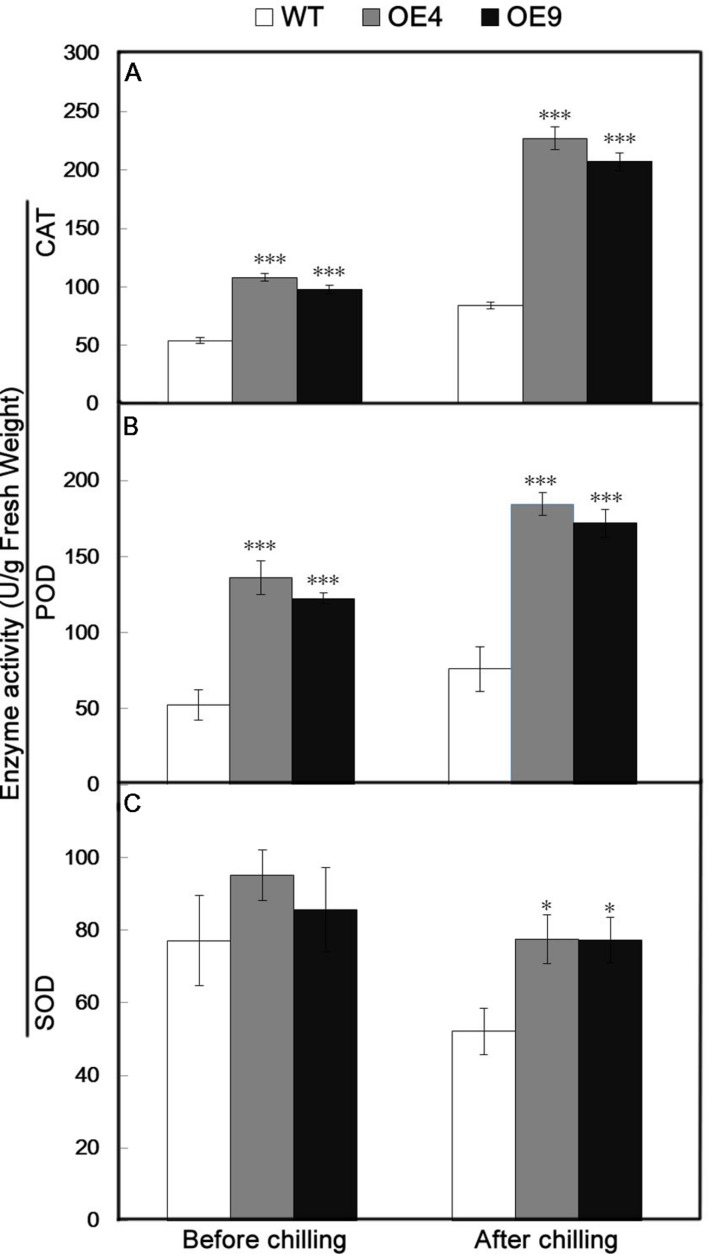
FIGURE 7.
Analysis of antioxidant enzyme activity in the WT and two transgenic lines (OE4 and OE9) before and after chilling treatment. (A–C) Activities of CAT, POD, and SOD, respectively. Data represent the means ± SE of at least three replicates. The significant differences between the WT and transgenic plants are indicateded by asterisks (∗P < 0.05, ∗∗∗P < 0.001).

