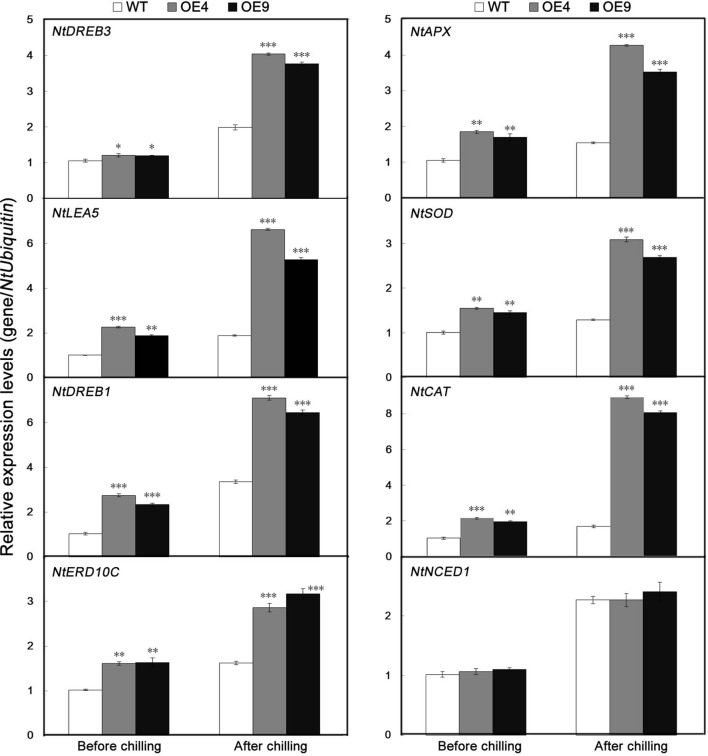
FIGURE 8.
Analysis of relative expression levels of stress-responsive and ROS-related genes by quantitative real-time PCR in WT and transgenic lines (OE4 and OE9) before and after chilling treatment. Data represent the means ± SE of at least three replicates. Significant differences between the WT and transgenic plants are indicated by asterisks (∗P < 0.05, ∗∗P < 0.01, ∗∗∗P < 0.001).

