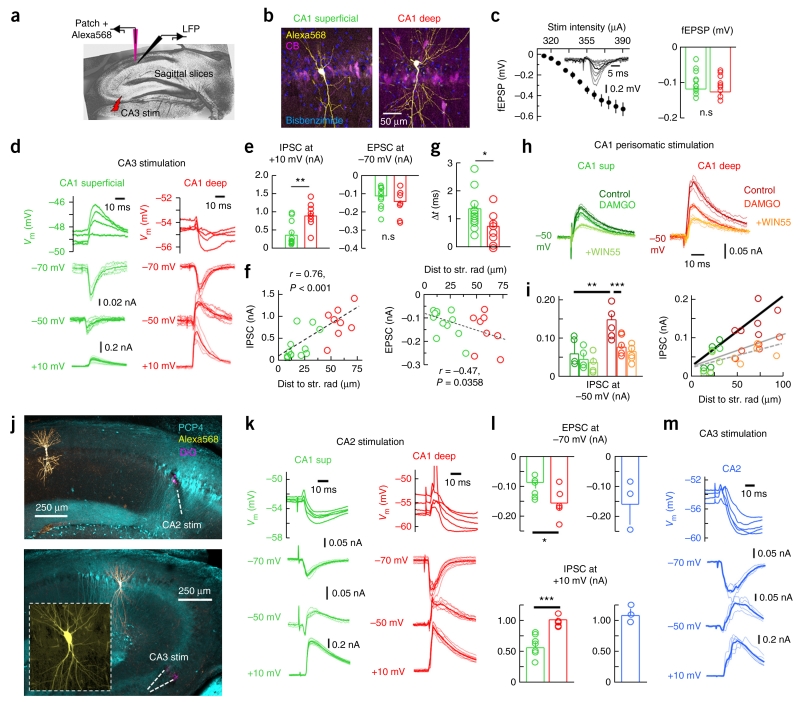
Figure 5.
Mechanisms of CA1 PC heterogeneity studied in vitro. (a) Schematic representation of in vitro experiments. (b) Classification of CA1 PCs as deep and superficial. Average intensity projection from three (7.66 μm, deep) and seven optical sections (19.86 μm, superficial). (c) Stimulation intensity (inset, radiatum field excitatory postsynaptic potentials (fEPSP)) was adjusted to obtain similar fEPSPs in slices used to evaluate deep (n = 8) and superficial cells (n = 12, P = 0.6831, right). (d) Representative current- and voltage-clamp responses of deep and superficial CA1 PCs to CA3 stimulation. (e) Stronger ISPCs were evoked in deep PCs at +10 mV (P = 0.0021, t(18) = −3.39; n = 8 deep, n = 12 superficial). EPSCs at −70 mV was not significant (P = 0.2221). (f) Correlation between the amplitude of IPSC (left) and EPSC (right) and distance to radiatum. (g) Group differences of onset timing between excitation and inhibition (P = 0.0431, t(18) = −2.18). (h) Evaluation of perisomatic stimulation responses in deep and superficial PCs. Representative responses to perfusion with the μ-opioid receptor antagonist DAMGO (200 nM) and the CB1R agonist WIN55,212 (5 μM). (i) IPSC amplitude measured at −50 mV in deep (n = 5) and superficial PCs (n = 4) in response to pharmacological interventions. **P = 0.0061, t(7) = −3.87; ***P = 0.0055, t(4) = 5.44. The relationship between the IPSC amplitude and the distance to radiatum (control, thick line, r = 0.86, P = 0.0012) was reduced by DAMGO (gray continuous line, r = 0.78, P = 0.0131) and remained non-significant after WIN55,212 (discontinuous line). (j) Confirmation of CA2 stimulation with DiO and PCP4 immunolabeling. Bottom, confirmation of CA2 PC identity. Images were taken at 10×. Inset, 40×. (k) Representative responses of deep and superficial CA1 PCs to CA2 stimulation. (l) Deep (n = 5) and superficial (n = 7) CA1 PC responses to CA2 stimulation (EPSCs: P = 0.0474, t(10) = −2.25; IPSCs: P = 0.0007, t(10) = 4.81). Right, similar data from CA2 cells in response to CA3 stimulation (blue, n = 3). (m) Responses of a representative CA2 pyramidal cell to CA3 stimulation. *P < 0.05, **P < 0.005, ***P < 0.0001.

