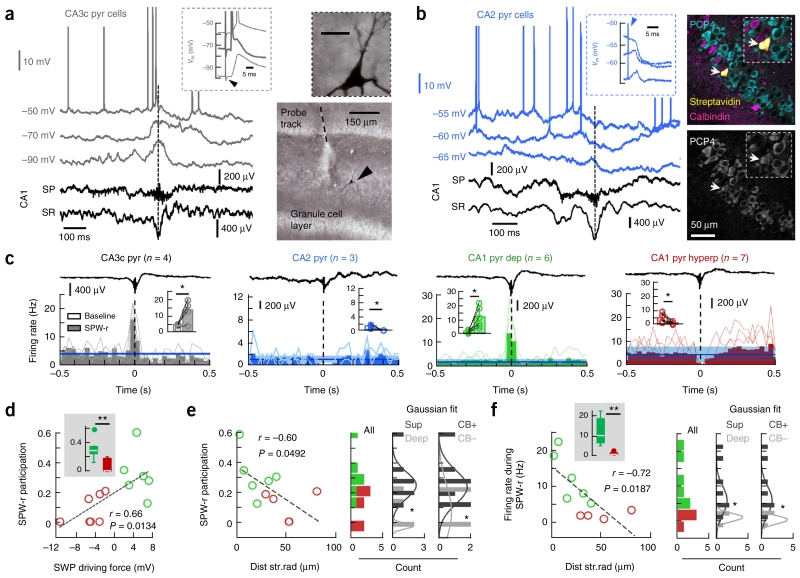
Figure 6.
Microcircuit control of SPW-associated responses in dorsal PCs in vivo. (a) Representative response of a CA3c PC during SPWs recorded in CA1 (discontinuous line). Inset, ortodromic and antidromic (thick line) responses to cCA3 stimulation (arrowhead). Right, cell identification with DAB reaction at 10× and 100× (inset, scale bar represents 20 μm). Note large spines (thorny excrescences). (b) Data are presented as in a for a representative CA2 PC. Right, validation with PCP4 immunolabeling (arrows, 3 optical sections, 2.92 μm). (c) Firing rate histograms (bin size of 30 ms) of PCs recorded along the cornu ammonis at resting membrane potentials are aligned by CA1 SPW ripples. Blue lines represent mean firing rate (s.d. is shadowed) as estimated from baseline (−500 to −400 ms). Insets, firing rate modulation before (baseline) and around SPW peak (60-ms window). CA3c: P = 0.0464, t(3) = −3.27, n = 4; CA2: P = 0.0441, t(2) = 3.13, n = 3; CA1 depolarized: P = 0.0173, t(5) = −3.49, n = 6; CA1 hyperpolarized cells: P = 0.0275, t(6) = 2.89, n = 7. (d) Relationship between cell participation of SPW ripples and the associated driving force for all CA1 PCs shown before. Inset, significant group differences (P = 0.0034, t(12) = 3.63). (e) SPW participation against the distance to radiatum in histologically confirmed PCs (n = 6 depolarized, n = 4 hyperpolarized). Right, histograms from unclassified cells (all) and classified according to location (deep/superficial) and immunoreactivity (CB+/CB−) tested against a Gaussian distribution (Shapiro-Wilk test). Deep: P = 0.1612, W = 0.82; superficial: P = 0.1609, W = 0.87; means are significantly different at P = 0.0431, t(8) = 2.35, unpaired t test. For CB+: P = 0.1749, W = 0.87; CB−: P = 0.060, W = 0.77; means are significantly different at P = 0.0302, t(8) = 2.146 for an unpaired t test, but not for a Mann-Whitney test. (f) Data are presented as in e for firing rate data. Shapiro-Wilk test for deep: P = 0.7804, W = 0.98; superficial: P = 0.5954, W = 0.93; means are significantly different at P = 0.043, t(8) = 1.94, unpaired t test. For CB+: P = 0.5954, W = 0.93; CB−: P = 0.7804, W = 0.98; means are significantly different at P = 0.043, t(8) = 1.94, unpaired t test. *P < 0.05, **P < 0.005, ***P < 0.0001.

