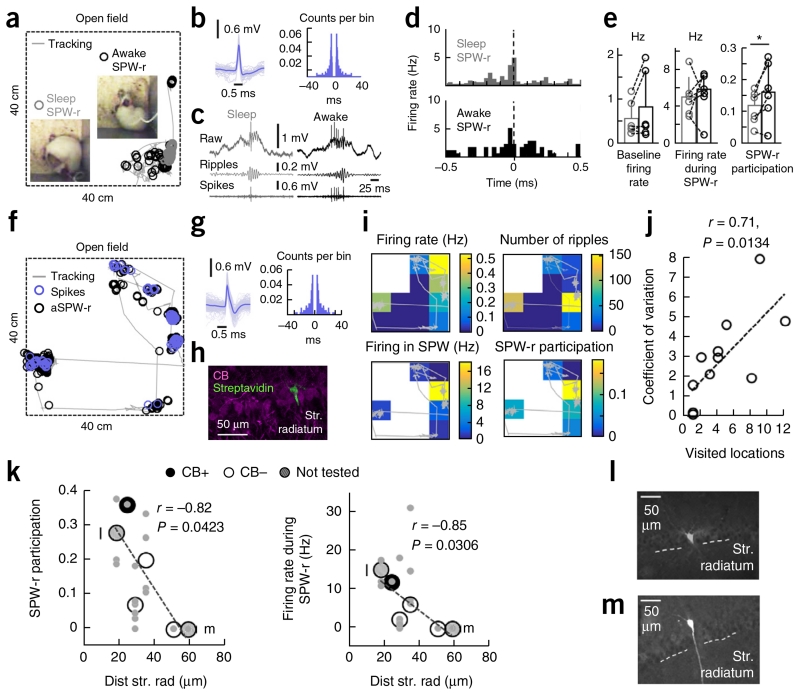
Figure 7.
CA1 PC participation during SPW ripples in drug-free conditions. (a) Single-cell recording of CA1 PCs and LFPs in freely moving rats enabled identification of activity patterns during sleep (gray) and awake (black) conditions. Insets, representative behavior. (b) Action potential waveform and firing autocorrelogram of the cell recorded from the rat shown in a. (c) Representative examples of sleep and awake SPW ripples. Ripples: 100–200-Hz filtered raw signal; spikes: high-pass signals at 300 Hz. (d) Firing rate histograms (30-ms bins) of the cell shown before for all SPW ripples recorded during sleep (221) and awake (60). (e) State-dependent effects were not significant for the baseline firing rate (P = 0.1887, t(5) = −1.52) or the firing rate during SWP ripples (P = 0.8661, t(5) = −0.18), but reached significance for SPW ripple participation (P = 0.0420, t(5) = −2.71; n = 6 CA1 PCs, 1 histologically confirmed). *P < 0.05. (f) Recordings obtained from freely moving rats also allowed us to examine spatial effects in awake SPW ripple participation (black). Spikes are shown in blue. (g) Spike waveform and autocorrelation of the cell recorded in f. (h) Juxtacellular labeling and post hoc identification of the cell in g confirmed it was a deep CB− PC (3 optical sections, 6 μm). (i) Spatial dependence of activity of cell shown in g. (j) Relationship between the coefficient of variation of the firing rate during awake SPW ripples and the number of visited locations (4 × 4) in the 40-cm × 40-cm arena (n = 11 cells, 6 histologically confirmed). (k–m) Participation (left) and firing rate (right) during SPW ripples against the distance to radiatum for histologically confirmed cells (n = 6). Values represent means for the entire recording session. Individual values during different states (awake, sleep) and spatial locations for each cell are shown in gray. Calbindin classification is shown, except for two not tested cells indicated in by letters and shown in l and m.

