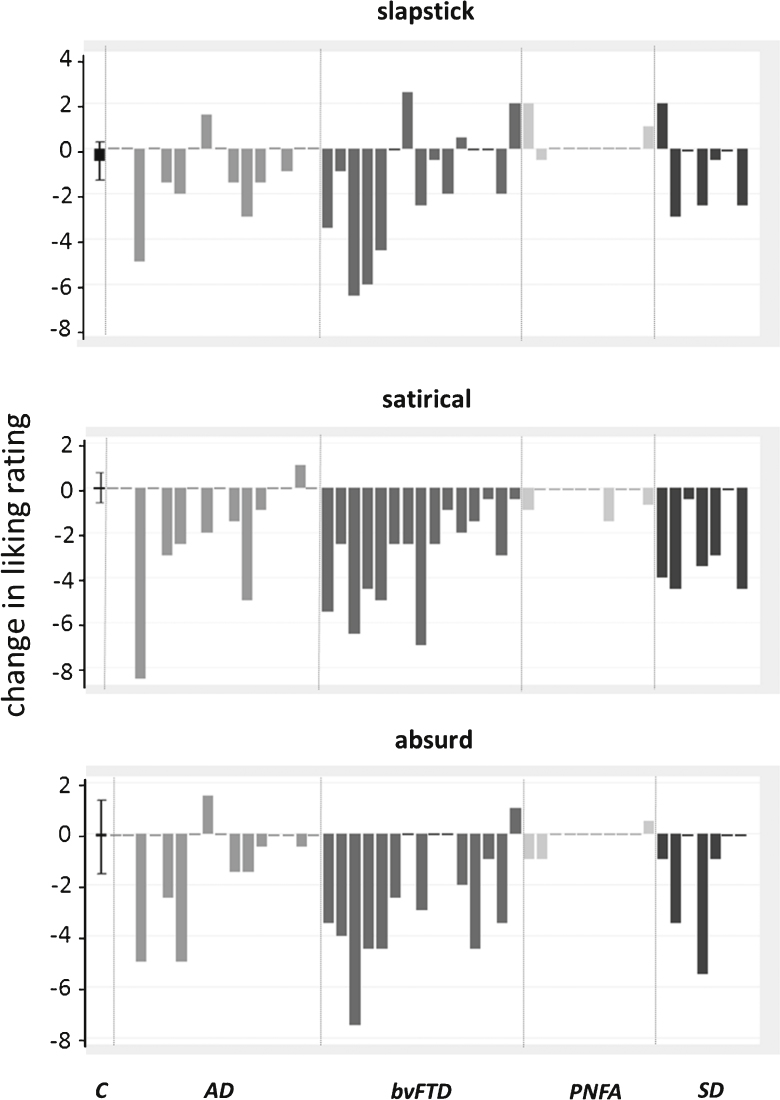
Fig.1.
Questionnaire data on changes in liking of comedy over a 15 year interval are shown for individual patients in each disease group (Alzheimer’ disease, AD; behavioral variant frontotemporal dementia, bvFTD; progressive nonfluent aphasia, PNFA; semantic dementia, SD) alongside the mean change in liking for the healthy control group (C), with error bars indicating standard deviation from the mean in controls. Data for each comedy genre are plotted in separate panels. In each plot, the zero line indicates no change over the interval; values below the line indicate reduced liking and values above the line increased liking for that comedy genre, on a 10-point Likert scale (see text and Table 2 for details).

