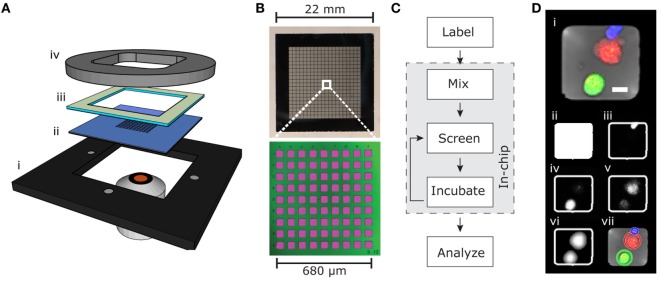
Figure 1.
Microchip screening platform. (A) Holder (i), microchip (ii), PDMS gasket (iii), and plastic lid (iv). (B) Detailed view of the silicon–glass microchip showing photograph of the whole chip (top) containing 32,400 microwells arranged in 20 × 20 subunits each containing 9 × 9 microwells (bottom). The bottom image is produced by confocal fluorescence imaging of microwells filled with fluorescent solution (pink) and reflection from the silicon–glass interface (green). (C) Flow chart outlining the screening process. (D) Example RGB-transmitted light composite image (i) from an individual well containing one live target cell (green), one dead target cell (red), and one NK cell (blue). Scale bar represent 10 μm. The automated software-detected microwell is shown in (ii). The blue channel (iii) shows the calcein orange-stained NK cell, and the green channel (iv) shows the calcein green-stained target cell. The red channel (v) contains both weak DDAO fluorescence from the live target cell and stronger DDAO fluorescence from the dead target cell. The filtered image of the target cells (vi) is used for the automated software detection of live and dead target cells shown as circles in (vii).

