
Figure 3.
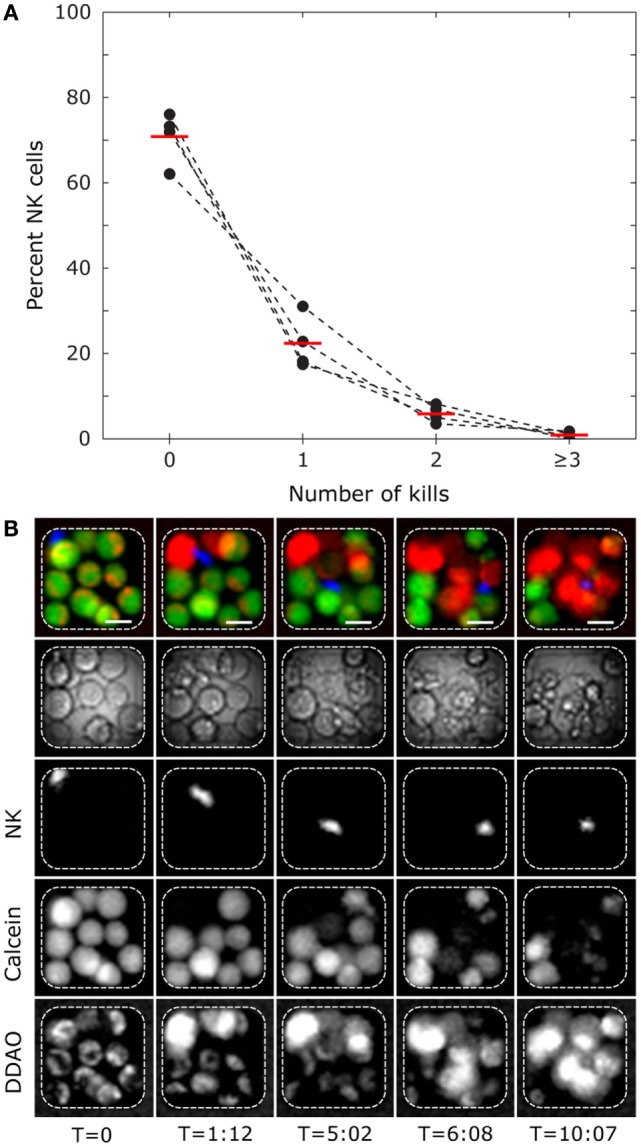
Single-cell level cytotoxicity of resting human polyclonal NK cells revealed by time-lapse imaging in microwells. (A) Frequency of NK cells killing between 0 and ≥3 target cells. Wells containing single NK cells and at least three live K562 target cells were selected for analysis. Presented data are from four donors (black circles connected by dashed lines) with mean values shown by red bars (ntotal = 322). (B) Time-lapse sequence showing a serial killer that eliminates 8 target cells in the 12-h experiment. The rows show from top to bottom: RGB composite of fluorescent channels for NK (blue) and target cells (green and red), transmitted light, calcein orange NK channel, target cell calcein green, and target cell DDAO channels. Each column represents different time points (hours:minutes). Scale bars represent 15 μm. Images have been resampled and adjusted for brightness and contrast.