
Figure 4.
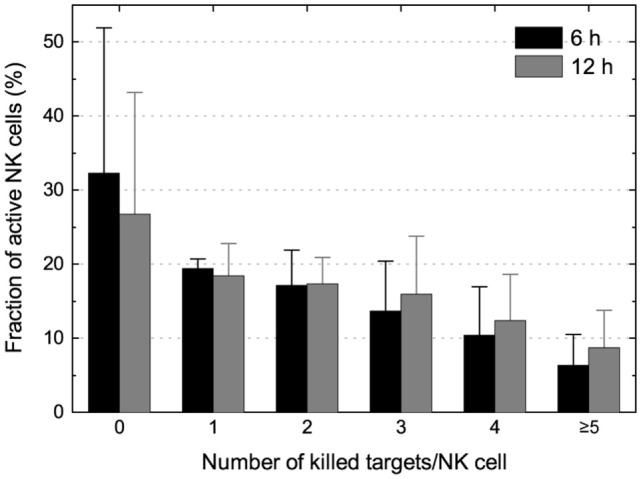
Enumeration of killing potential and assessment of NK serial killing. Distribution of NK cells killing 0, 1, 2, 3, 4, or ≥5 K562 target cells at T6h (black bars) and T12h (gray bars). Wells were selected for analysis based on having a single live NK cell at T0h (and ≤1 live NK cell at later time points) and ≥5 live target cells before NK cell seeding (T-NK).