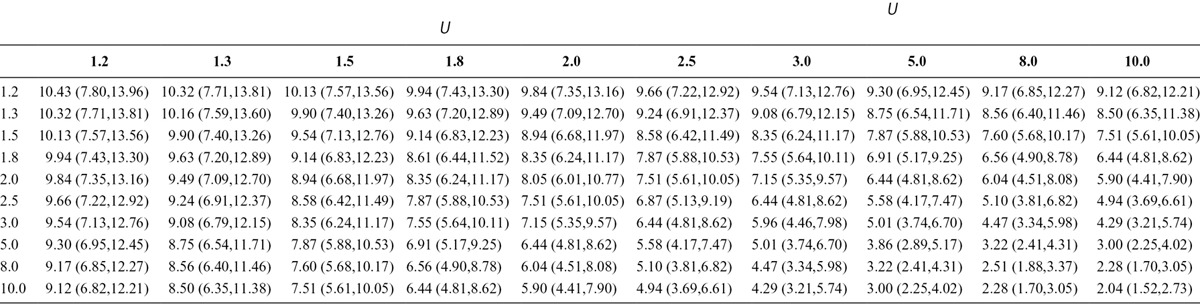
TABLE 2.
Bounds on Corrected Estimates, Lower Confidence Limits, and Upper Confidence Limits for Unmeasured Confounding (Each Cell Contains Bounds on Point Estimate, Lower and Upper Confidence Limits; Columns Correspond to Increasing Strength of the Risk Ratio of on the Outcome; Rows Correspond to Increasing Strength of Risk Ratio Relating the Exposure and )