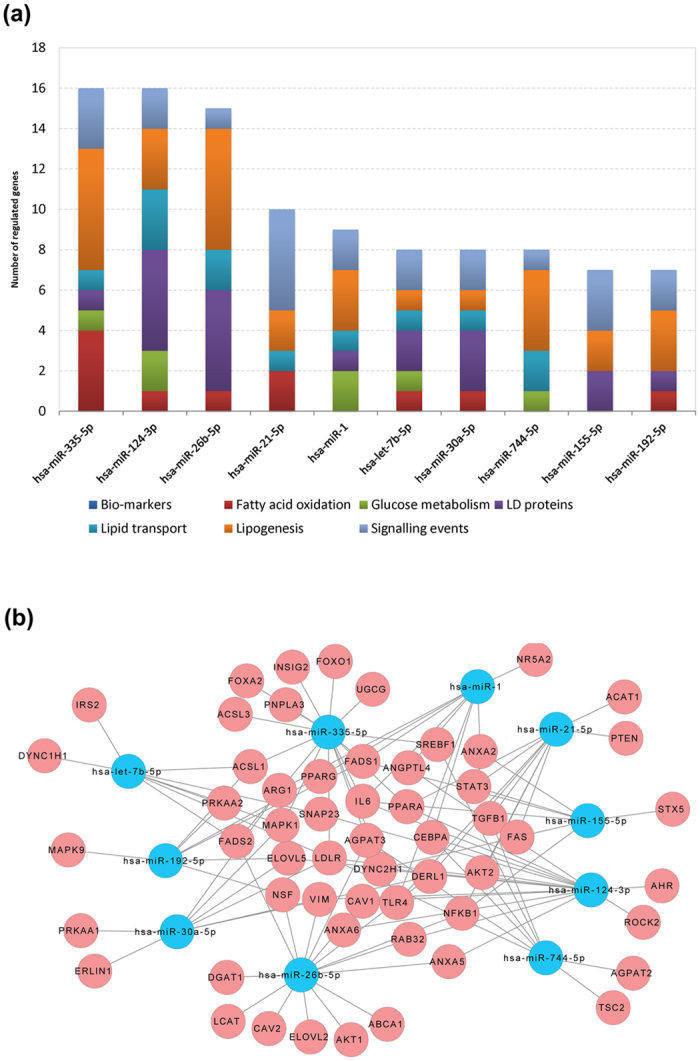
Figure 3. DIS associated gene regulations by miRNAs.

(a) The histogram depicts the top 10 ranked miRNAs and their distribution amongst different lipid droplet associated processes; (b) Cytoscape network analysis of mechanistically linked LD-associated gene regulations of the top 10 ranking miRNAs. The blue and pink colored nodes refer to miRNAs and LD-associated genes, respectively.
