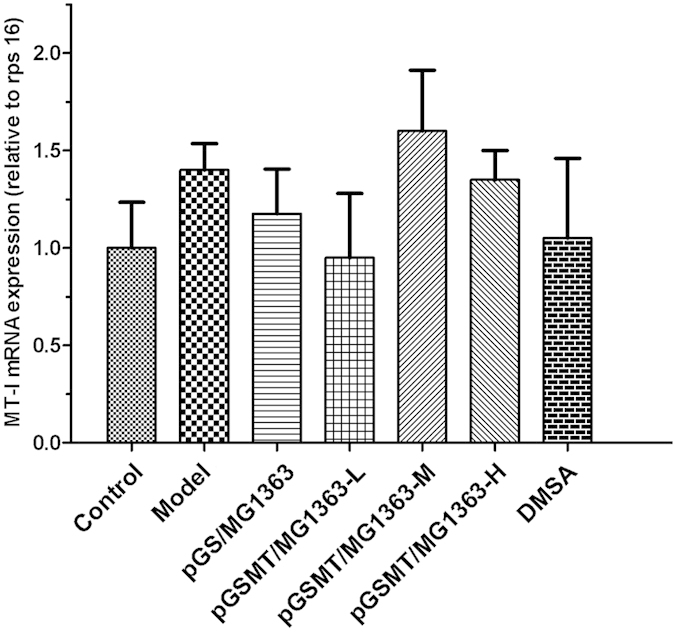
Figure 8. mRNA analysis of MT-I in the intestine after treatment with lead and recombinant L. lactis strains.

The relative expression levels of mt-I detected by RT-PCR were compared with that of rps 16 and expressed as the mean ± S.E.s. (n = 5).

The relative expression levels of mt-I detected by RT-PCR were compared with that of rps 16 and expressed as the mean ± S.E.s. (n = 5).