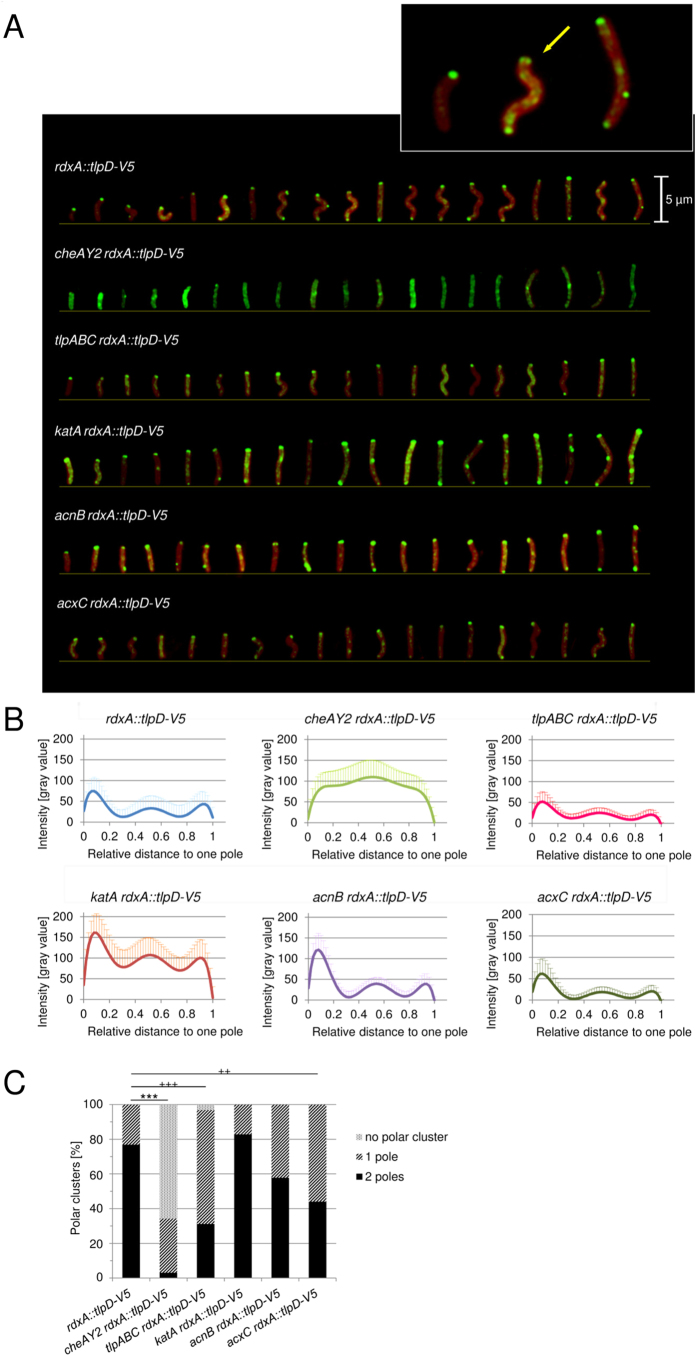
Figure 3. Subcellular localisation of TlpD in H. pylori in the presence and absence of potential interaction partners.
(A) Subcellular localisation of TlpD in intact, permeabilised H. pylori cells grown on plates for 20 h (standard high-energy conditions) was imaged by immunofluorescence microscopy (IF; for details of sample preparation see Supplementary Methods). Cells were immediately immersed in fixing agent after harvest. Green: TlpD-V5 was detected using primary mouse α-V5 antibody (1:1,000), combined with secondary α-mouse IgG coupled to Alexa-488 (diluted 1:5,000); Red: SynaptoRed FM4-64 (1:5,000) membrane marker. Specimens were visualised in a Zeiss Apotome fluorescence microscope at a 63-fold lens magnification. A constant exposure time and the same digital image lighting correction functions were used and adjusted equally for all specimens; in each panel, 19 representative cells from one experiment are arranged according to cell length. Arrows point at polar TlpD localisation foci. Inset: three representative images of the N6 rdxA::tlpD-V5 reference strain were magnified by an additional 4.5 fold. The size bar represents 5 μm. (B) Subcellular distribution of TlpD-V5-derived fluorescence intensities (α-V5 MAB) in the H. pylori parental strain and corresponding mutant strains deficient in TlpD-interacting proteins AcnB, KatA or AcxC. A tlpABC triple transducer mutant, lacking three of the four H. pylori Tlps, and a cheAY2 (chemotaxis null) mutant were used as additional control strains. Growth conditions and sample preparation were the same as in panel A. The fluorescence intensity distribution patterns were quantitated by averaging the pixel intensities in transversal sections (of one pixel length and 8 pixel width) along the longitudinal (x) axes for 15 bacteria from each strain using ImageJ, and then calculating average distribution patterns for all bacteria of each strain (Table 3). The polar and non-polar distributions of TlpD were compared statistically (for details see Supplementary Methods).(C) Quantification of polar TlpD clusters per cell for ≥30 bacteria per strain. Clusters at one and both poles were counted visually, and levels of significance were calculated by Fisher’s exact test, for the two conditions polar vs. non-polar clusters (***p ≤ 0.001), and for cluster distribution at 1 vs. 2 poles (+++p ≤ 0.001, ++p ≤ 0.01).

