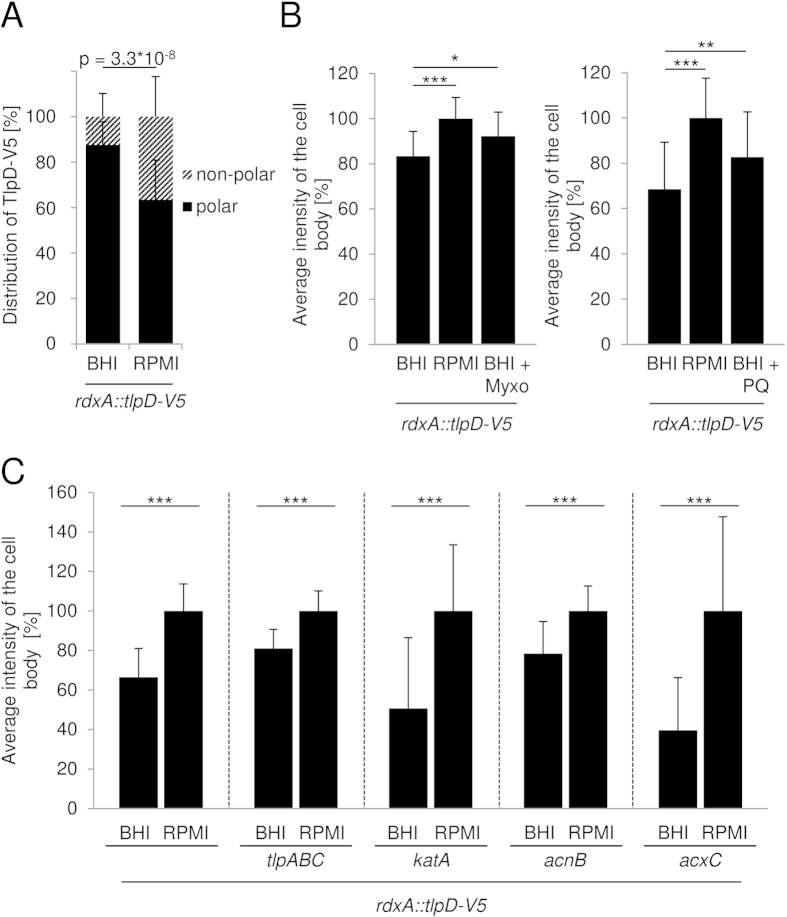
Figure 6. Subcellular localisation of H. pylori TlpD under different energetic conditions.
(A) TlpD-V5 localisation at bacterial poles and cell body was quantitated by immunofluorescence (IF) and compared for N6 rdxA::tlpD-V5 (reference strain) in BHI-yeast, 3% FCS (BHI, high energy yield26) and RPMI 1640, 3% FCS (RPMI, low energy yield26). For IF quantitation, 20 h plate-grown bacteria were incubated in media for 20 min, then immediately fixed and immunolabelled (Supplementary Methods). Total cell intensities were set to 100%; polar and cell body pixel intensities are depicted in percent of total intensities. p-value indicates significant difference between conditions for poles or cell body. (B) TlpD-derived intensities for the cell body only were determined for the reference strain to detect energy-dependent differences in non-polar TlpD. Incubation conditions were: BHI, RPMI, BHI and myxothiazol13 (Myxo, 10 μM for 10 min; left panel, for respiratory inhibition), or BHI and paraquat (PQ, 10 μM for 30 min; right panel for oxidative stress). Myxothiazol or PQ was added after 20 min equilibration in BHI. The fluorescence intensity of the sum of all pixels in the cell body without the poles was first calculated in percent of the total cell pixel intensities added up for each strain; subsequently, cell body-associated intensities in RPMI were set to 100%. Fluorescence intensities of the bacterial cell body omitting the poles were averaged for 30 bacteria under each condition (Supplementary Methods). (C) TlpD localisation in the cell body in the reference strain and the corresponding acnB, katA, tlpABC, acxC mutants was determined under two energetic conditions. 20 h plate-grown bacteria were resuspended in liquid media RPMI or BHI for 20 min. Cell body intensities in RPMI were calculated as in B and set to 100% (right bar for each strain), with normalised relative values in percent for the BHI condition (Supplementary Methods). For all panels and settings, mean and standard deviations of TlpD-derived intensities averaged for 30 bacteria are depicted. IF images were taken at 63-fold magnification. Poles and cell body regions were defined as in Table 3. Significance of differences was determined using Student’s t test (***p ≤ 0.001, **p ≤ 0.01, *p<= 0.05).

