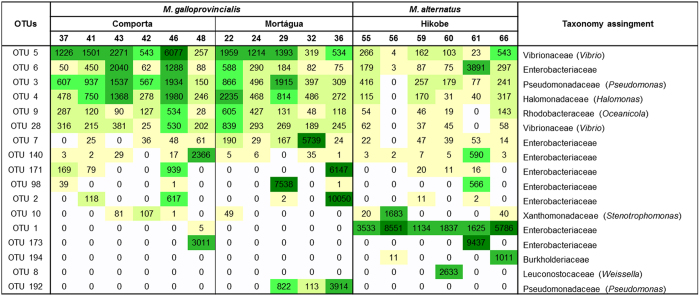
Figure 3. Heatmap for the OTUs that represent more than 10% of the total number of reads.
The colour gradient goes from light yellow for the lower numbers of reads, to dark green for the higher numbers of reads. The numbers in the third top line represent the last two digits in the sample name (see Table 2).

