
Figure 2. Sirt6 heterozygosity exacerbates atherosclerosis development.
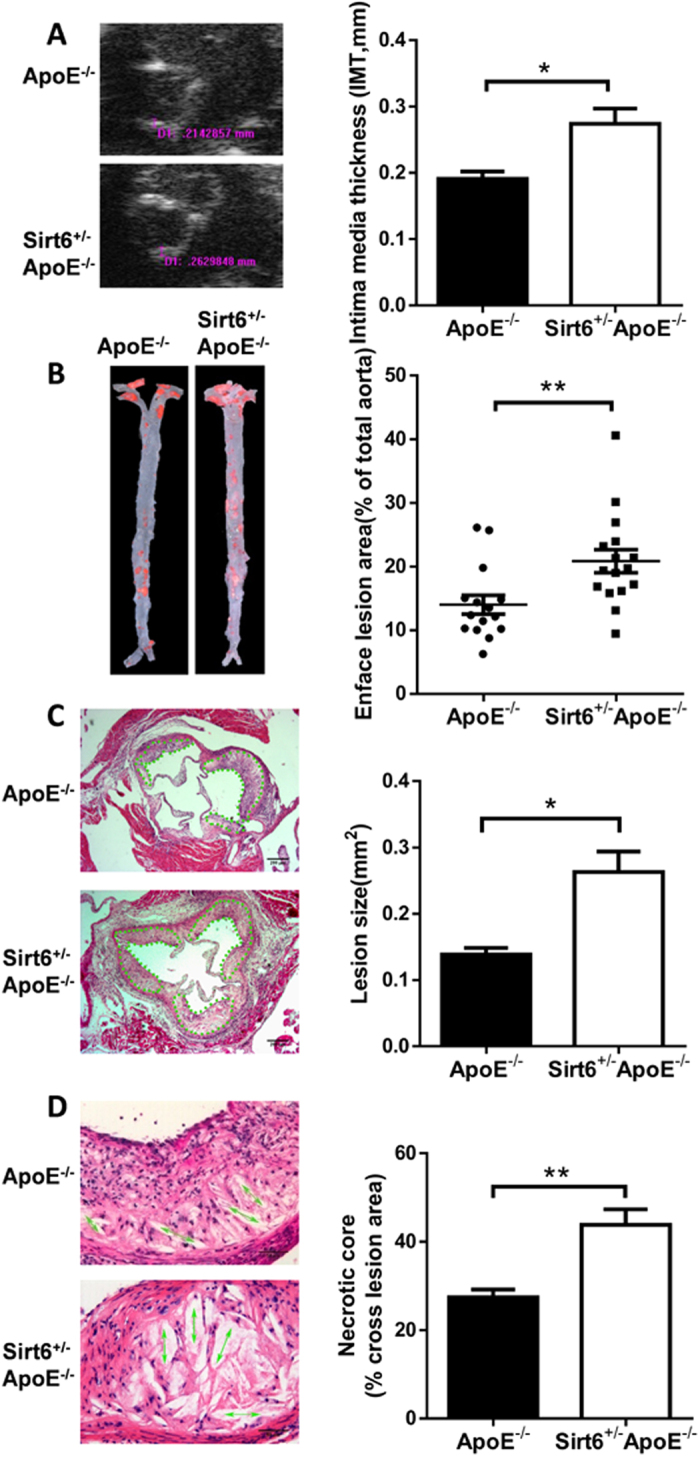
ApoE−/− and Sirt6+/−ApoE−/− mice were fed with Western diet for 16 weeks and plaque lesion was determined by different methods. (A) The intima media thickness (IMT) of the aortic root was measured by ultrasound biomicroscopy. ApoE−/− group (n = 15), Sirt6+/−ApoE−/− group (n = 13). (B) The plaque area in the aortas was determined by en face staining for lipids with Oil Red O. ApoE−/− group (n = 15), Sirt6+/−ApoE−/− group (n = 16). Quantification of the surface area relative to the total aorta was shown. Each symbol represents a measurement from a single mouse. (C) The atherosclerotic plaque lesion area of the aortic sinus was assessed by H&E staining. ApoE−/− group (n = 10), Sirt6+/−ApoE−/− group (n = 12). Dot lines indicate the area that was measured. (D) The area of the necrotic core of the atherosclerotic plaques was determined by H&E staining (n = 8 each group). Arrows indicate the field that was measured. Value was normalized to total cross lesion area. The statistical analysis is shown on the right side of each panel. Student’s t test was used to calculate the P value. (*P < 0.05, **P < 0.01).