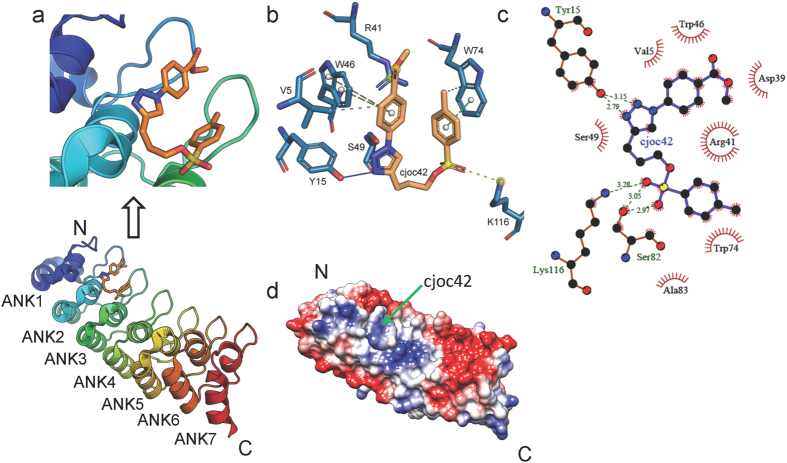
Figure 5. In silico analysis of the gankyrin-cjoc42 interaction.
(a) The docking site of cjoc42 on gankyrin (pdb 1QYM) with a close-up of the interacting interface shown above. The pose represents the top ranked (i.e. lowest energy, ∆G = −6.3 kcal/mol) pose obtained from blind docking using AutoDock Vina. Similar results were obtained using AutoDock 4.2 and EADock DSS. (b,c) Ligand interaction diagram of the docked pose of cjoc42 on gankyrin. The diagrams were generated using PLIP (b) and LigPlot+ (c). (d) The electrostatic surface potential representation of gankyrin with cjoc42 docked onto it. Red, blue, and white represent acidic, basic, and neutral (hydrophobic) regions, respectively, with the sliding colour scale (±5 kTe−1, where k is the Boltzmann constant, T is temperature and e is the elementary charge) below indicating the charge distribution across the gankyrin surface.

