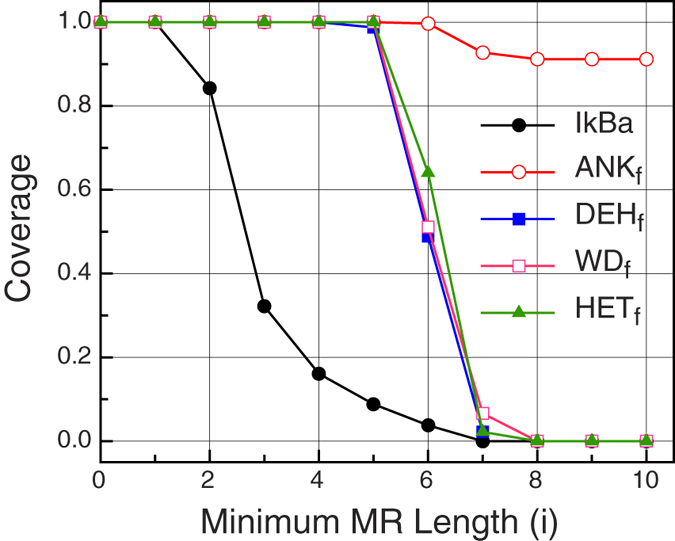
Figure 3. Coverage of a trial sequence of IκBα using different MR sets.

MR sets were computed from the sequence itself (black) or using groups of sequences derived from distinct families. Values come from applying  function for t = IκBα, ANKf, DEHf, WDf, HETf and i = 0, ..., 10.
