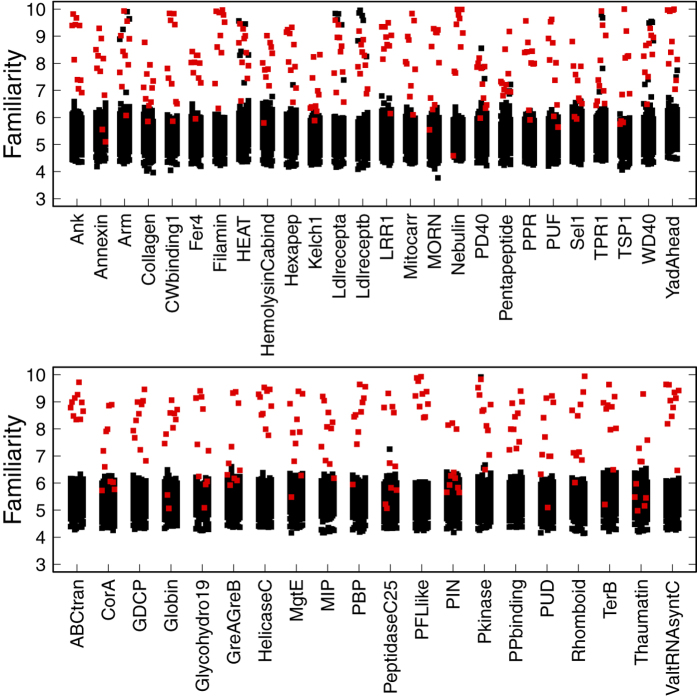
Figure 4. Familiarity of natural protein sequences against the MR of natural protein families.
A point denotes a sequence, the x-axis indicates de protein family and the y-axis the familiarity value. When the protein is known to belong to the family indicated n the x-axis, the point is colored in red, otherwise in black. The upper panel contains repeat protein families, and the lower panel contains globular families.

