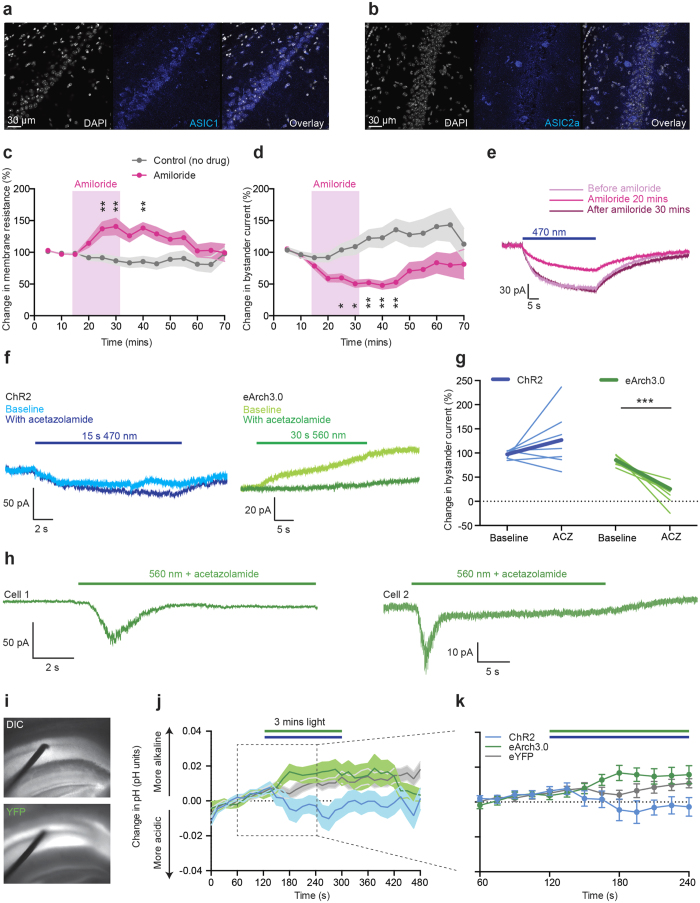
Figure 8. The contribution of acid-sensing ion channels to the bystander effect.
(a,b) ASIC1 (a) and ASIC2a (b) expression in CA1. (c) Change in membrane resistance during amiloride (ASIC antagonist) application (lilac-shaded region) (n = 6–18 cells, 9 mice, two-way ANOVA for interaction between time and drug treatment (F (12,314) = 2.617, p = 0.0018, asterisks indicate significant time points after Dunnet’s multiple comparison test). Grey data points: control experiment in which no amiloride was applied (n = 4–16, 6 mice) (no significant change from baseline). (d) Change in bystander current during amiloride application (F (12,314) = 2.473, p = 0.0032, asterisks indicate significant time points). No significant change from baseline for untreated control cells. (e) Examples bystander current at baseline baseline (dark red), after 20 mins amiloride (pink), and after 30 mins of washout (lilac). (f) Example ChR2 and eArch3.0 bystander currents in 500 μM acetazolamide (pale traces indicate baseline recordings, dark traces indicate 15 mins acetazolamide exposure). (g) Change in bystander current magnitude after acetazolamide application (thick line represents group mean) (ChR2, n = 7 cells, 3 mice, paired t-test: t = 1.313, df = 6, p = 0.2372; eArch3.0, n = 7 cells, 3 mice, paired t-test: t = 6.177, df = 6, p = 0.0008). (h) Occasionally, acetazolamide caused eArch3.0 bystander neurons to exhibit inward ASIC-like currents during green light. (i) Extracellular pH measurements in CA1 (contralateral to site of opsin injection) in acute slices using a solid state metal wire oxide pH sensor (100 μm diameter, 5X magnification). (j) pH change in response to three minutes of light stimulation (470 nm for ChR2 and YFP-controls, 560 nm for eArch3.0). For ChR2, n = 24 recording sites, 13 slices, 3 animals. For eArch3.0, n = 21 recording sites, 11 slices, 3 animals. For YFP controls, n = 22 recording sites, 12 slices, 2 animals. (k) Zoom-in of last minute of baseline pH recording and first two minutes of light stimulation.

