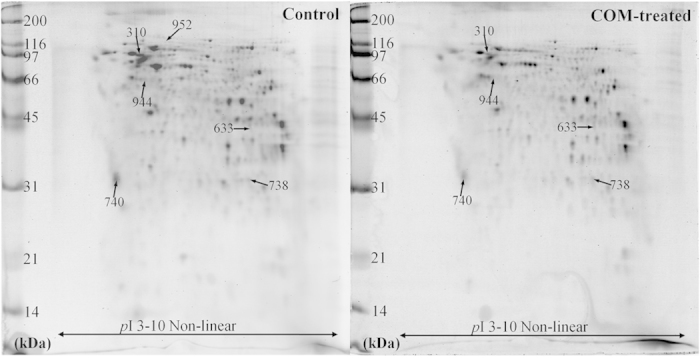
Figure 2. 2-D map of changes in basolateral secretome induced by COM crystals.

Proteins derived from lower chamber of Transwell (or basolateral compartment of polarized cells) with equal amount of 80 μg were resolved by 2-DE and visualized with Deep Purple staining. Spot matching and intensity analysis revealed significant differences in levels of six protein spots (labeled with spot numbers) between the controlled and COM-treated groups. These proteins were then identified by Q-TOF MS/MS analysis (see details in Table 1). N = 5 independent gels in each group (a total of 10 gels were analyzed).
