Figure 1.
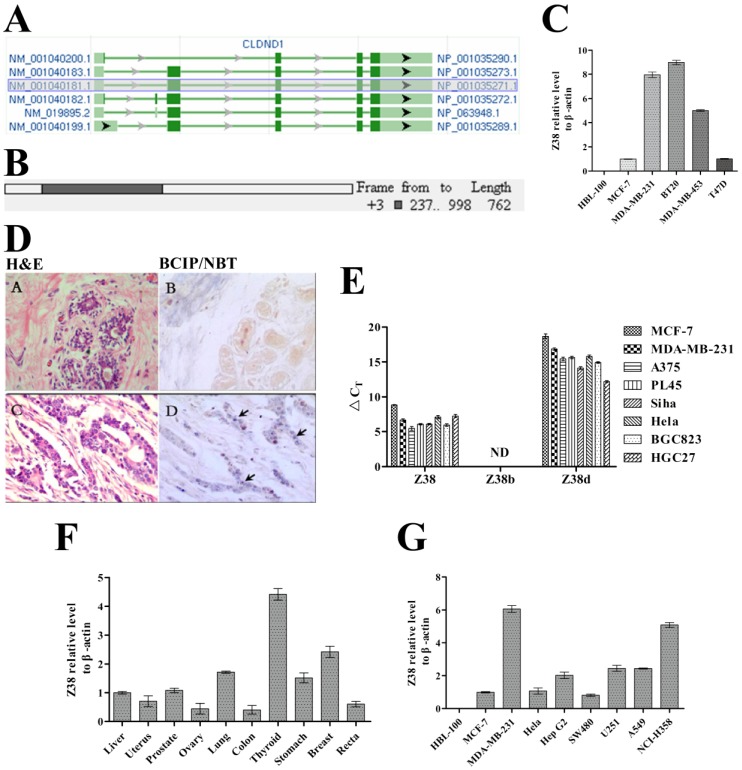
The structural analysis of RNA gene Z38 and its relative expression level in cancer. (A) The structures of the predicted CLDND1 mRNAs on NCBI. (B) A simulated diagram of Z38 structure. (C) Z38 expression profile of different breast cancer cell lines and breast epithelial cell line HBL-100, assayed by qRT-PCR (Z38 relative expression level of MCF-7 = 1). (D) A (breast paraneoplastic tissues) and C (breast cancer tissues) are images of H&E staining; B (breast paraneoplastic tissues) and D (breast cancer tissues) are images of in situ hybridization. The violet dots and arrows in D represent the expression of Z38. (E) △CT (CT, Target gene-CT, GAPDH) showing the relative expression level of Z38, Z38b, and Z38d in different cancer cell lines. ND: Not Detected. (F and G) Z38 expression profile of different cancer tissues (Z38 relative expression level of liver cancer tissue = 1), and cancer cell lines (Z38 relative expression level of MCF-7 = 1) and breast epithelial cell line HBL-100, assayed by qRT-PCR.

