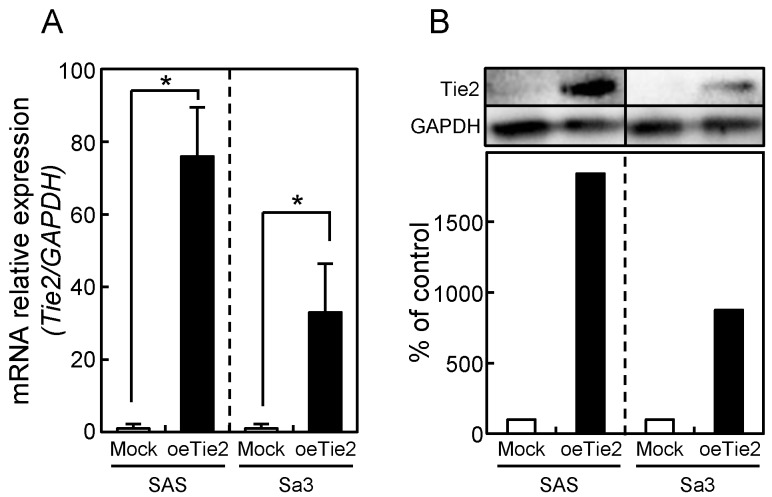
Figure 3.
Establishment of Tie2 overexpressed cells. Significant (*p < 0.05, Mann-Whitney U-test) up-regulation of Tie2 mRNA (A) and protein (B) are observed in oeTie2 cells compared with Mock cells using qRT-PCR and immunoblot analyses. Densitometric Tie2 protein data are normalized to GAPDH protein levels. The values are expressed as a percentage of the Mock cells.

