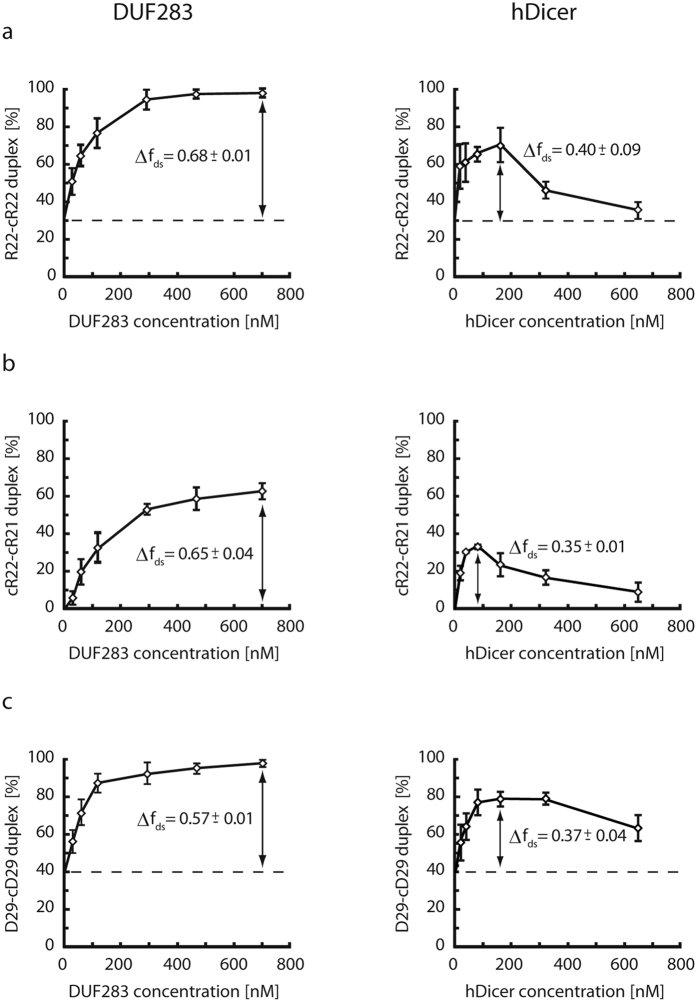
Figure 6. Comparison of DUF283 and hDicer annealing capacities.
Graphic presentation of the results obtained from three independent annealing assays involving DUF283 (left) or hDicer (right) and three oligonucleotide pairs, as follows: (a) R22 and cR22; (b) cR22 and cR21; (c) D29 and cD29. The x-axis represents the DUF283/hDicer molar concentrations and the y-axis the percentage content of the double-stranded fraction [fds]. Dashed lines are drawn for the values obtained for control experiments with BSA (baselines). For each tested pair, the maximum increase in the double-stranded fraction [Δfds], driven either by DUF283 or hDicer, was calculated.

