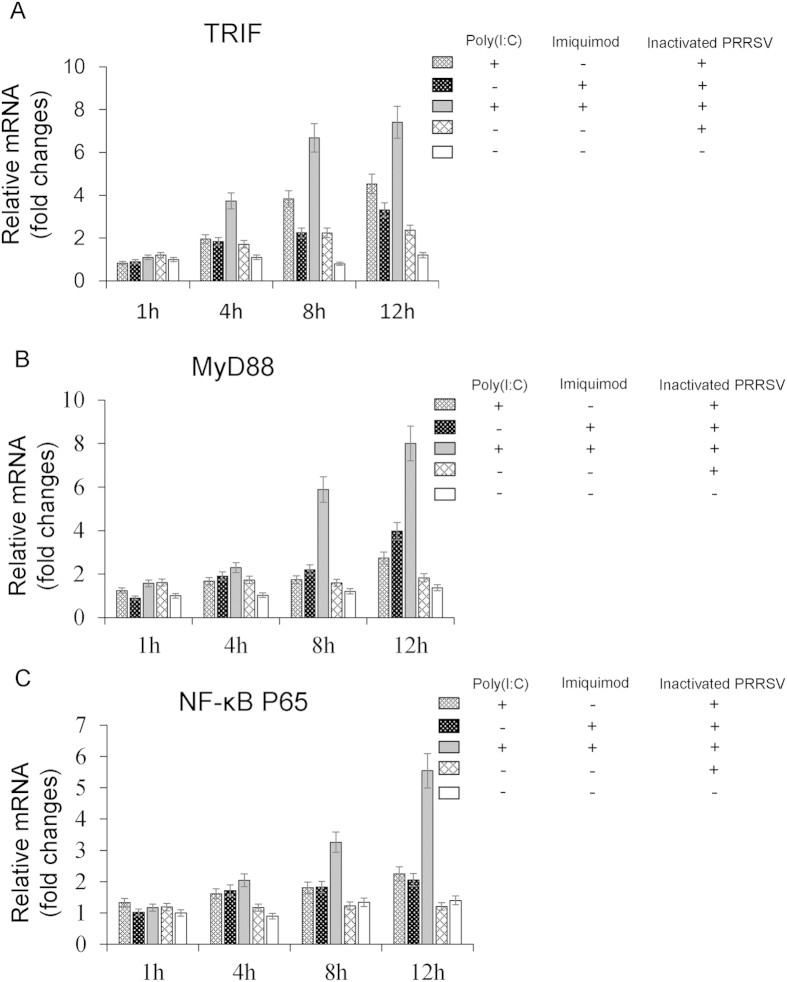
Figure 2. The mRNA levels of TRIF, MyD88 and NF-κB P65 in MoDCs stimulated with TLR ligands and inactivated PRRSV antigen for different times.
MoDCs were incubated with poly (I: C) and/or imiquimod along with inactivated PRRSV antigen for 1 h, 4 h, 8 h and 12 h, the inactivated PRRSV antigen and RPMI-1640 were used as control. The mRNA levels of TRIF, MyD88 and NF-κB P65 were analyzed by real-time RT-PCR. Relative transcript levels are shown as fold changes relative to the level for the control cells of the RPMI-1640 group. The data represent the means of three independent experiments, with each experiment performed in triplicate. Data represent the means ± standard deviations (error bars) of three experiments.

