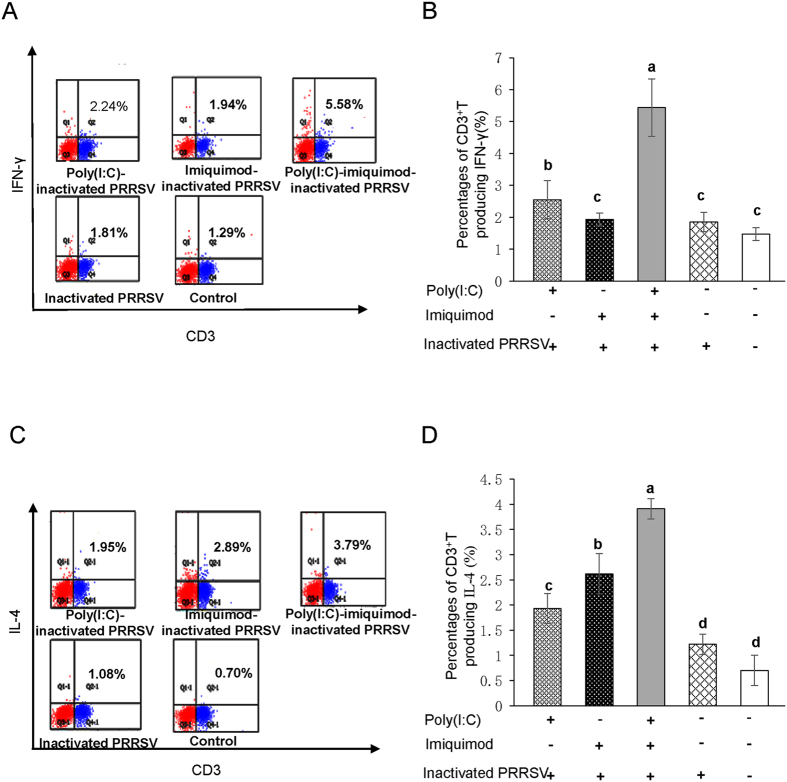
Figure 7. Percentages of PRRSV-specific CD3+ T cells producing IFN-γ and IL-4 in immunized mice.
DCs were isolated from spleen of mice and stimulated with inactivated PRRSV antigen for 12 h, then DCs were co-cultured with sorted autologous CD3+ T cells. Percentages of CD3+T cells producing IFN-γ and IL-4 were detected by flow cytometry. (A) Representative flow cytometry profile of the percentages of CD3+ T cells producing IFN-γ. The data presented here are results from one experiment of three flow cytometry experiments. (B) The statistical graph of the percentages of CD3+ T cells producing IFN-γ. (C) Representative flow cytometry profile of the percentages of CD3+ T cells producing IL-4. The data presented here are results from one experiment of three flow cytometry experiments. (D) The statistical graph of the percentages of CD3+ T cells producing IL-4. The data were analyzed using Flowjo7.6 software. Data represent the means ± standard deviations (error bars) of three independent experiments. Different letters (a–d) mean significant difference (P < 0.05).

