
Fig 2.
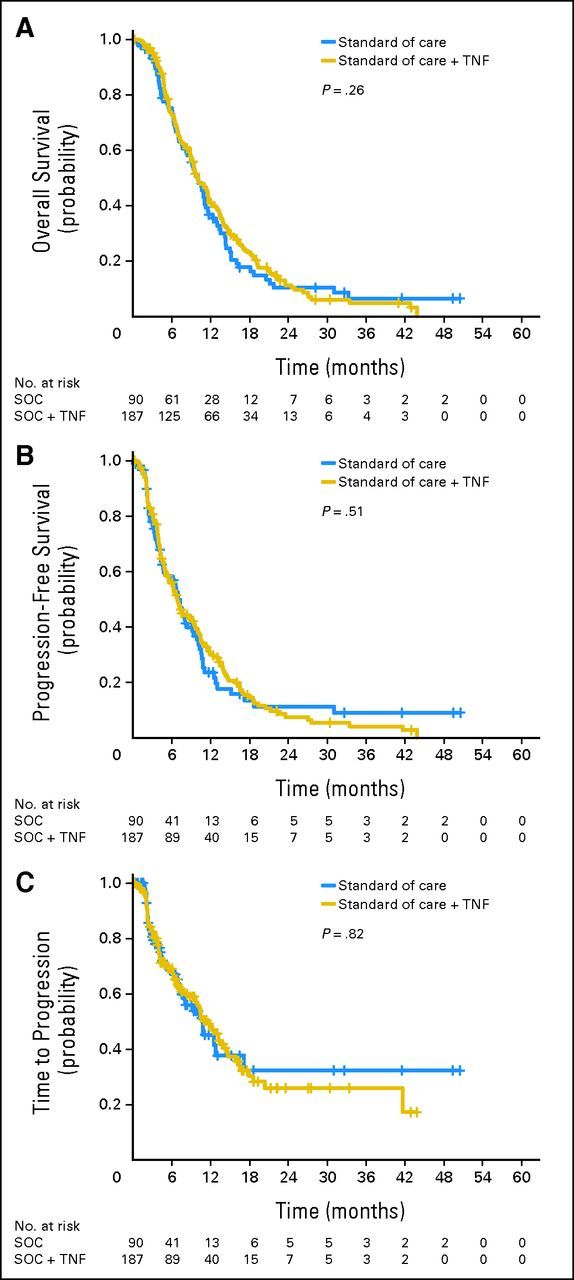
Kaplan-Meier curves depicting (A) overall survival, (B) progression-free survival, and (C) time to radiologic progression by modified intention-to-treat groups. P values given in each panel represent the significance level obtained when groups were compared by univariate analysis. SOC, standard of care; TNF, TNFerade.