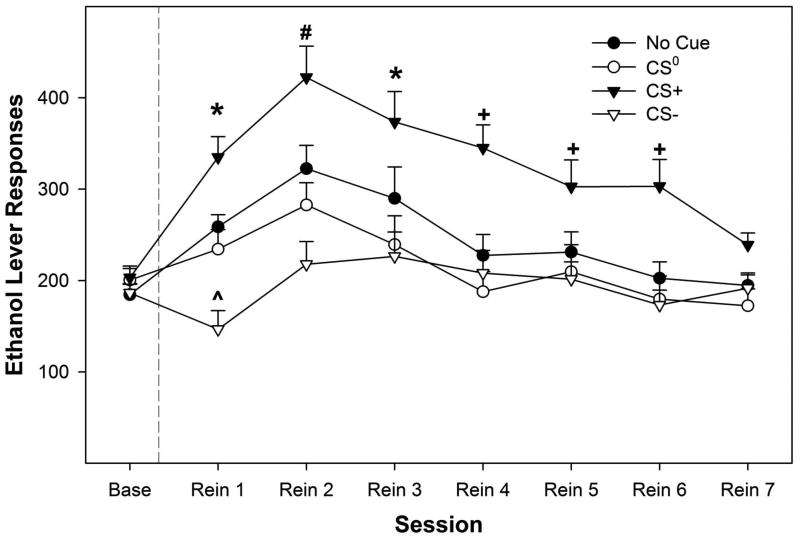
Figure 3.
Depicts the mean (+ SEM) responses on the EtOH lever during relapse conditions influenced by the presences of conditioned cues. * indicates that the CS+ > No Cue and CS0 > CS-, and CS+ group responded more, while the CS- group responded less, than baseline. (x0005E) indicates that the CS- group did not respond more than baseline and was significantly lower compared to all other groups. # indicates that the CS+ > No Cue, CS0 and CS-, and CS+ and No Cue groups responded more than baseline. + indicates that the CS+ > No Cue, CS- and CS0 , and CS+ group responded more than baseline.

