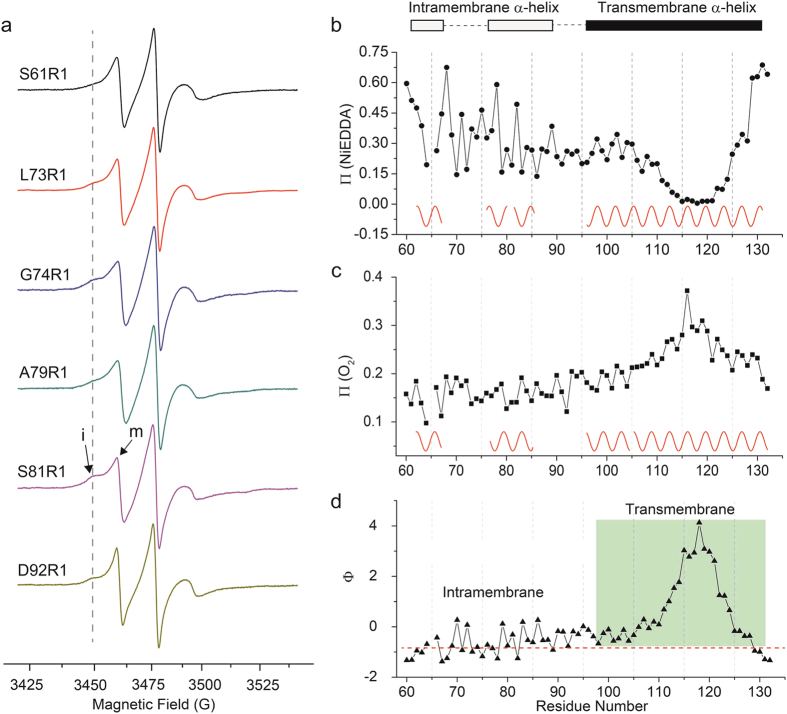
Figure 3. The EPR analysis of the hydrophobic region of IFITM3 in detergent micelles.
(a) The CW-EPR spectra exhibit multi-components in detergent micelles. “i” and “m” represent the “immobile” and “mobile” components, respectively. (b,c) represent the oxygen accessibility (ΠO2) and NiEDDA accessibility (ΠNiEDDA) of the hydrophobic region of IFITM3 in detergent micelles. Sine waves with a periodicity of 3.6 were drawn to indicate the α-helix secondary structure. (d) The membrane immersion depth (Φ) of sequential residues span the hydrophobic region of IFITM3 in detergent micelles. The grey region represents the putative transmembrane region and the dashed line indicates the suggested membrane interface.

