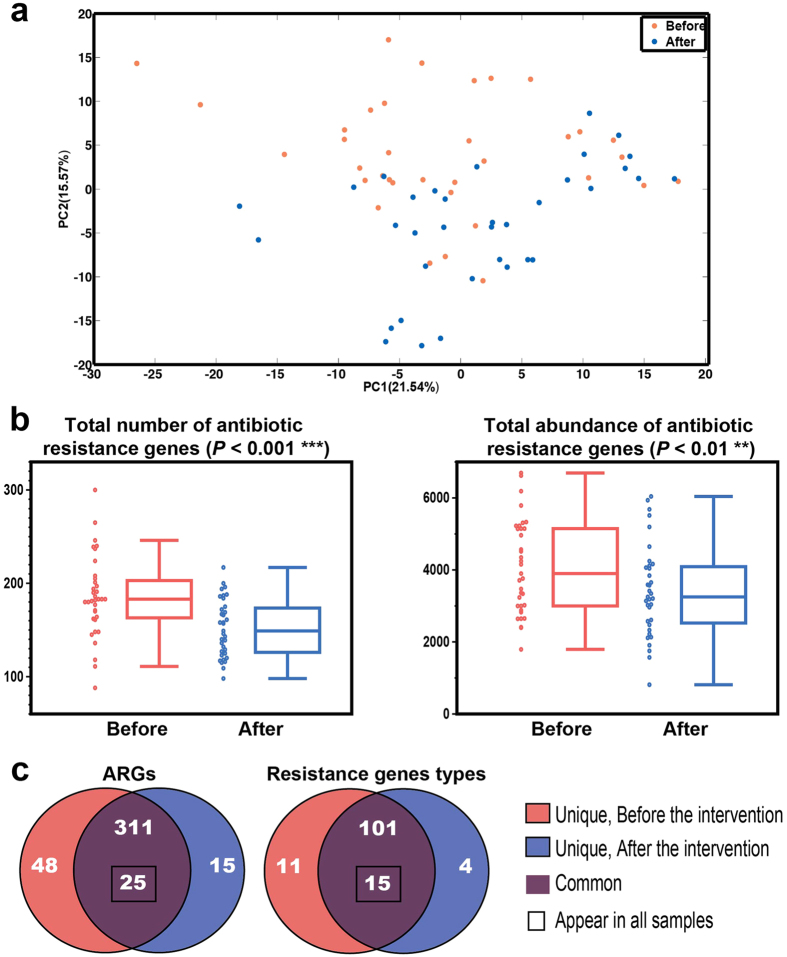
Figure 1. The overall structural alterations of the gut resistome after intervention.
(a) The PCA score plot based on the profile of 399 ARGs showing significant segregation between the samples before and after dietary intervention (log-transformed, PERMONOVA P = 0.0187, permutations = 9999). (b) The total number and abundance of ARGs. The boxes denote the interquartile range (IQR) between the first and third quartiles (25th and 75th percentiles, respectively), and the line inside the boxes denotes the median. The whiskers denote the lowest and highest values within 1.5 times of the IQR from the first and third quartiles, respectively. The samples are displayed as the dot on the left. Statistical analysis was performed with a two-tailed Wilcoxon matched-pairs signed rank test (n = 35). (c) The prevalence of ARGs and ARG responding to resistant gene types.

