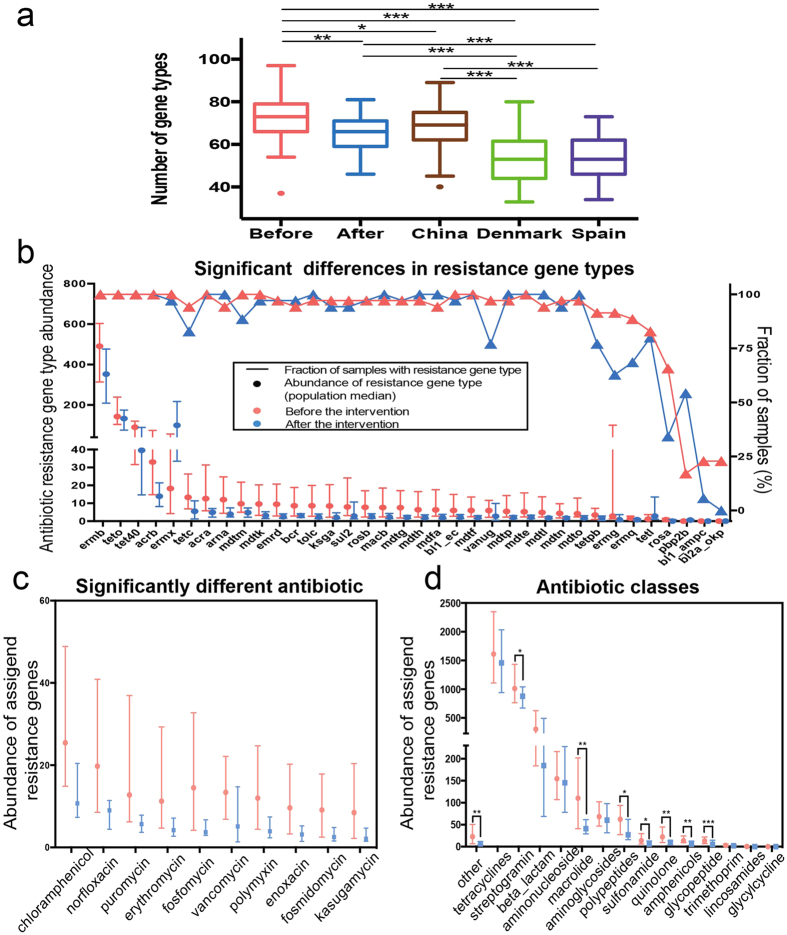
Figure 3. The antibiotic resistance genes that significantly changed after intervention.
(a) The number of antibiotic resistance gene types in our intervention trial (before and after) and three other cohorts (China, Denmark and Spain from ref. 5). The boxes denote the interquartile range (IQR) between the first and third quartiles (25th and 75th percentiles, respectively), and the line inside the boxes denotes the median. The whiskers denote the lowest and highest values within 1.5 times of the IQR from the first and third quartiles, respectively. (b) The 36 significantly changed gene types. The lines/triangle markers represent the fractions of samples before and after the intervention. The dot/bar markers represent the median and 25%/75% quartiles for the abundance of the gene types. (c) The significantly changed abundance (adjusted P < 0.05) of ARGs assigned to antibiotic compounds. Resistance genes were assigned to antibiotics according to the ARDB. The abundances of genes conferring resistance for the same antibiotic compound were summed. (d) The abundance of ARGs assigned to each antibiotic class. Resistance genes were assigned to antibiotic classes according to the ARDB. The abundances of the genes conferring resistance for the same antibiotic class were summed. Statistical analysis for (a) pairwise comparisons was performed with a two-tailed Mann–Whitney U test and a two-tailed Wilcoxon matched-pairs signed rank test (before n = 35, after n = 35, China n = 38, Denmark n = 85, and Spain n = 39); for (b–d), a Wilcoxon matched-pairs signed rank test (n = 35) was performed. *Adjusted P < 0.05, **Adjusted P < 0.01, ***Adjusted P < 0.001 (Benjamini & Hochberg 1995).

