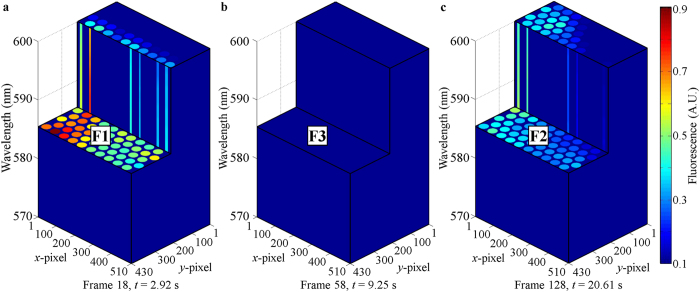
Figure 6. Each frame captured by the detector camera was used to build a 3-D datacube.
(a–c) show the cut-datacube acquired using frames 18, 58 and 128, which were captured ~2.92 s, 9.25 s and 20.61 s respectively after data acquisition started. (a) was acquired from Region F1 representing normal tissue with detection of high fluorescence intensity. (b) was acquired from Region F3 representing tumor growth in the advanced stage with detection of very low fluorescence intensity. (c) was acquired from Region F2 representing tumor growth in the intermediate stage with detection of low fluorescence intensity. These 3-D datacubes show the 4-D data (spatial-spatial-spectral-temporal) captured using the snapshot HS video-endoscope.

