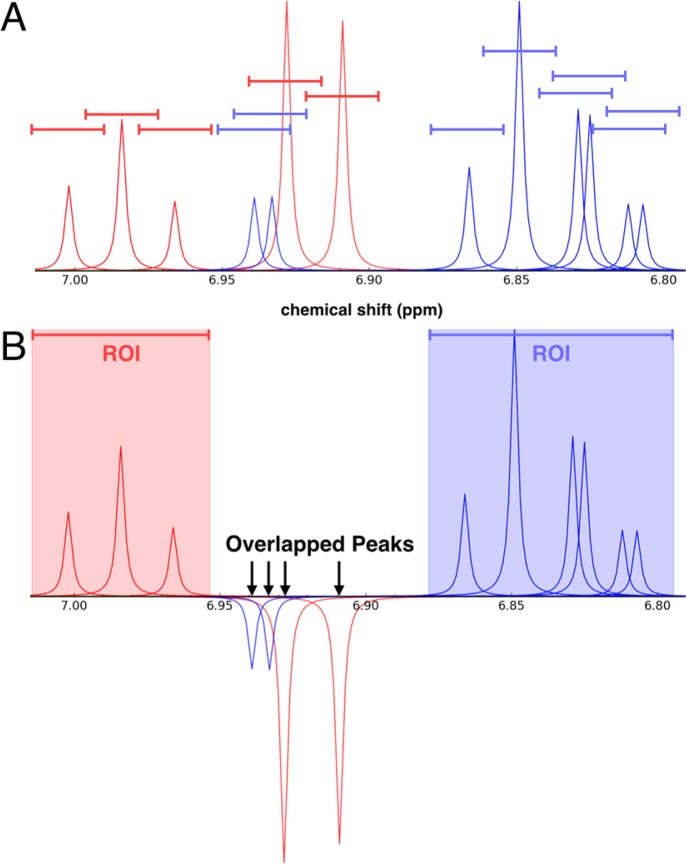
Figure 1.
(A) Simulated 1D 1H NMR spectrum of a mixture containing phenol (red peaks) and 4-chlorocatechol (blue peaks). The colored lines centered above each peak, which represent overlap ranges of 0.025 ppm, define the overlap regions. (B) This same mixture as viewed in NMRmix: peaks from different compounds whose ranges overlap are inverted; and, elsewhere, overlapping peak ranges from a given compound form a region of interest (ROI) for that compound.

