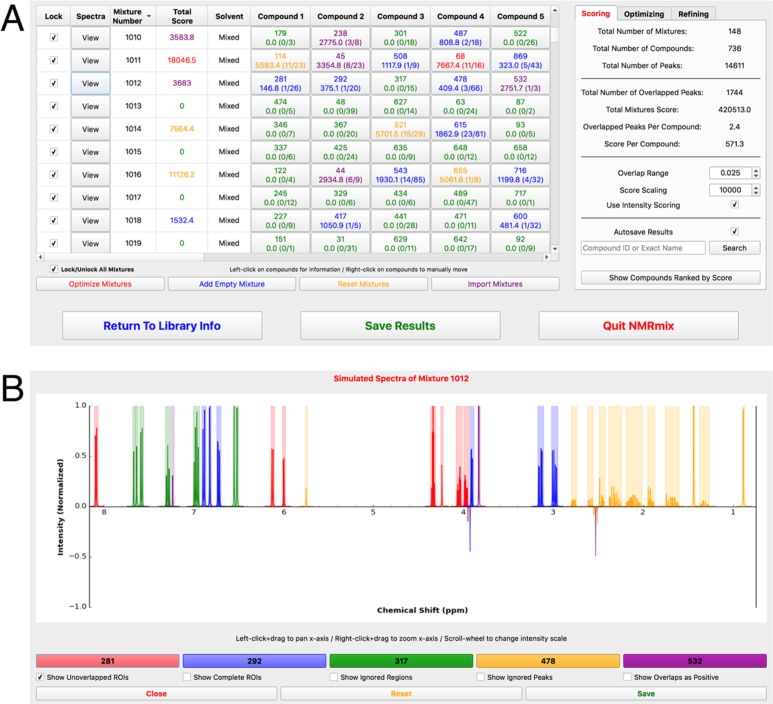
Figure 3.
(A) Representation of the mixing table view of NMRmix: Each row of the table represents a mixture and displays the compounds within each mixture and the overlap scores for each individual compound as well as the entire mixture. These mixtures were created using the default parameters, intensity scoring, and only 2500 annealing steps. (B) Simulated spectrum view of mixture 1012 from the mixing table. This mixture contains cytidine-5′-monophosphate (red), 3,4-dihydroxy-l-phenylalanine (blue), trans-2-hydroxycinnamic acid (green), adrenosterone (yellow), and acetosyringone (purple). As indicated in the mixing table view, mixture 1012 should have six overlapped peaks; these are visible in NMRmix view as negative peaks. Also shown are the colored ROIs for unambiguous identification of each compound.

