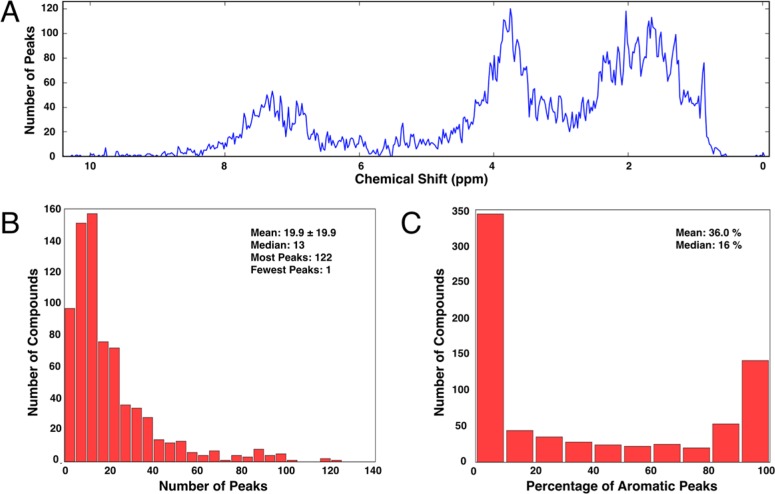
Figure 4.
NMRmix-generated representations of the peak list statistics for the virtual compound library imported from BMRB. (A) Histogram of the chemical shifts showing that the majority of the peaks occur in the low-frequency aliphatic region. (B) Histogram representing the number of peaks for each compound; the majority of the compounds have fewer than 20 peaks. (C) Percentage of aromatic peaks (≥4.7 ppm) per compound showing that nearly half of the compounds have <10% aromatic character.

