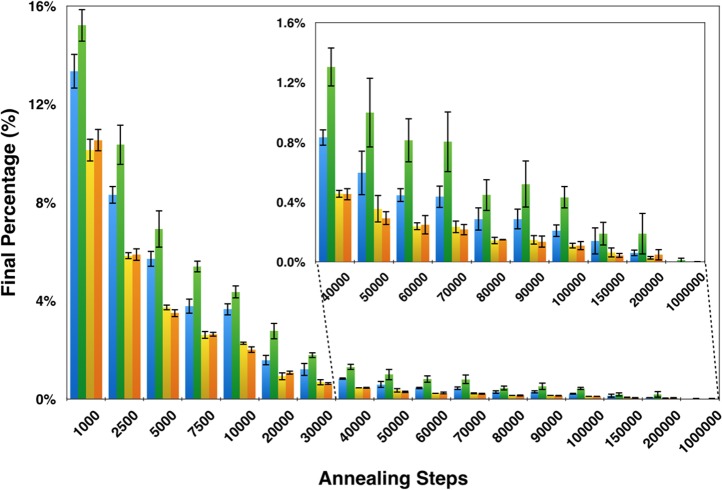
Figure 7.
Effect of the number of annealing steps used for optimizing mixtures with default parameters and a maximum mixture size of five compounds: total overlap percentage with standard scoring (blue); total overlap percentage with intensity scoring (green); total score percentage with standard scoring (yellow); and total score percentage with intensity scoring (orange).

