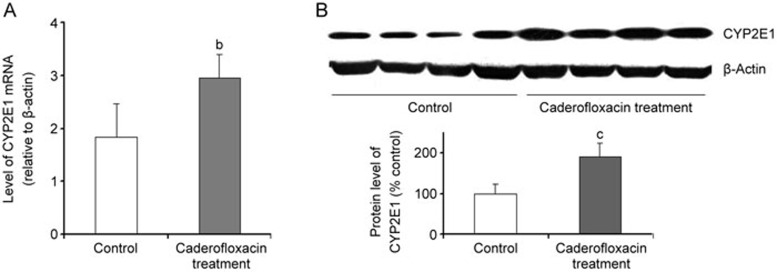
Figure 5.
The expression of (A) the mRNA levels and (B) the protein levels of CYP2E1 in the hepatic microsomes of control (white bar) and caderofloxacin-treated (shaded bar) rats. Caderofloxacin (9 mg/kg) was given via an intragastrical administration twice daily for 14 d. The data are expressed as the mean±SD (n=4). bP<0.05, cP<0.01 vs control rats.

