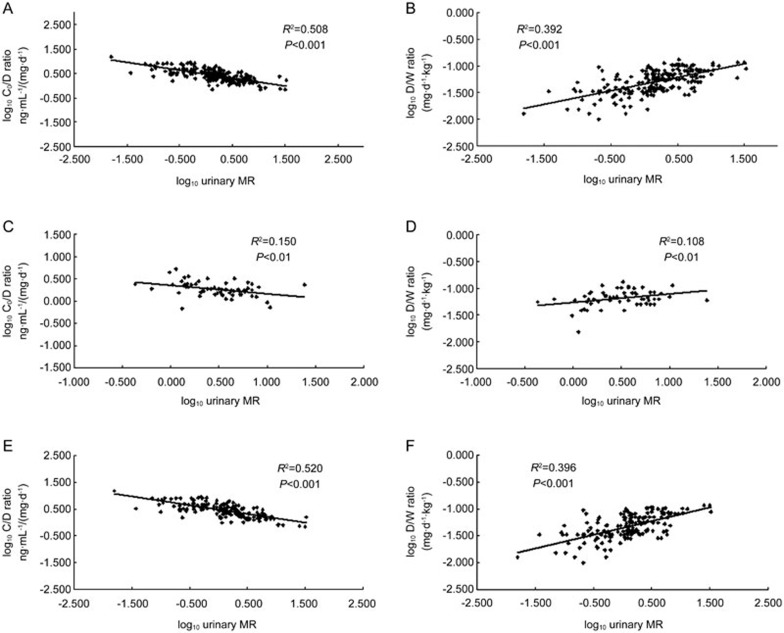
Figure 1.
Linear regression relationships between urinary MR and the C0/D and D/W ratios of tacrolimus across the different CYP3A5*3 genotypes: (A) with the C0/D ratio in overall subjects (n=231); (B) with the D/W ratio in overall subjects (n=231); (C) with the C0/D ratio in CYP3A5*1 carriers (n=58); (D) with the D/W ratio in CYP3A5*1 carriers (n=58); (E) with the C0/D ratio in CYP3A5*3/*3 genotype (n=173); (F) with the D/W ratio in CYP3A5*3/*3 genotype (n=173).

