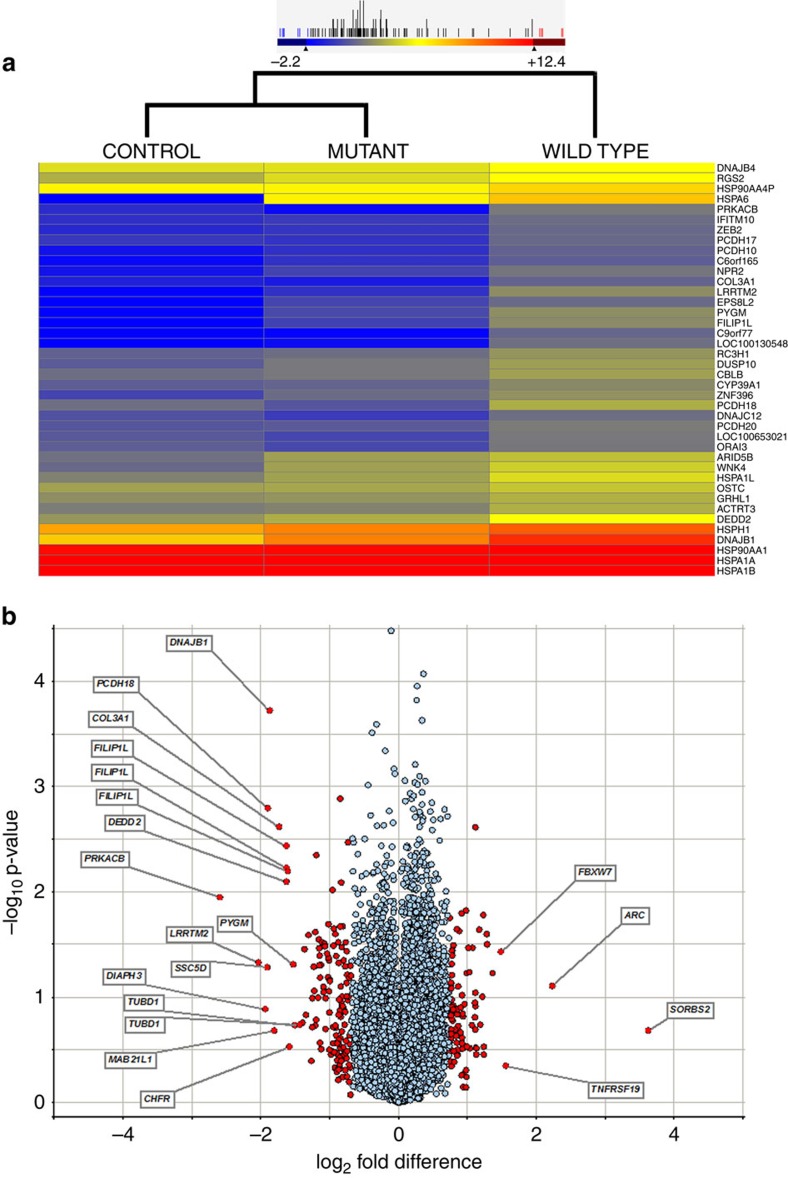
Figure 1. Illustration of the differentially regulated transcripts in HEK293 cells expressing mutant (p.C240*) FOXE3.
(a) Clustering of transcripts that are downregulated in cells expressing the mutant FOXE3. The differentially expressed genes were selected on the basis of stringent criterion (p-value ≤0.05 (Student's t-test) and ≥1.5-fold change). The colour of each horizontal line represents the expression of mRNA in a given sample, whereas colour scale from blue to red indicates low to high gene expression. (b) Volcano plot representation of differentially expressed transcripts and their statistical significance. The fold changes are represented in log2 scale depicted on the x-axis, whereas the −log10 p-value is depicted on the y-axis (the use of -log values mean that transcripts with greater statistical significance are higher in the plot). The red circles represent genes that show 3 s.d. differential expression, while red circles with gene names represent differentially expressed transcripts at 6 s.d.

