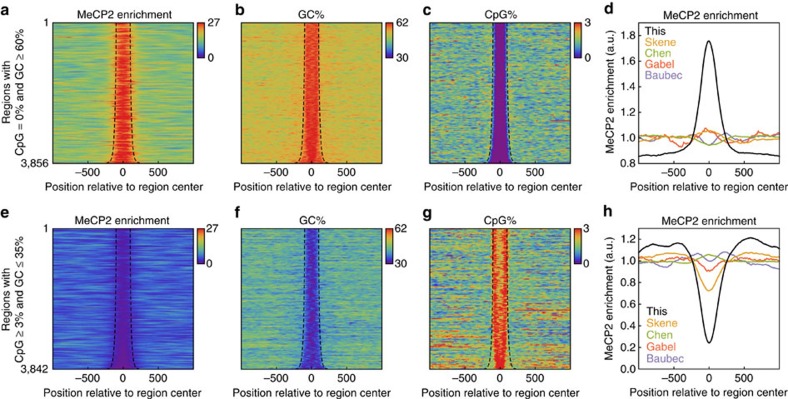
Figure 2. MeCP2 binding follows GC% in regions with extreme GC% and CpG%.
(a–c) Alignment plots showing MeCP2 enrichment, GC%, and CpG% (colour) around regions with no CpG and GC≥60%. These regions were identified genome wide using sliding windows, and overlapping regions were joined (the resulting regions are outlined by dashed curves). (d) Comparison of the aligned MeCP2 ChIP-seq signal in this and previously published studies using the regions in a–c. For Baubec et al., the figure shows the ESC data. The y axis represents ChIP/Input for all data sets, except for Skene et al. which does not have Input. (e–g) Same as a–c but showing regions with CpG≥3% and GC≤35%. (h) Same as d but using the regions from e–g.

