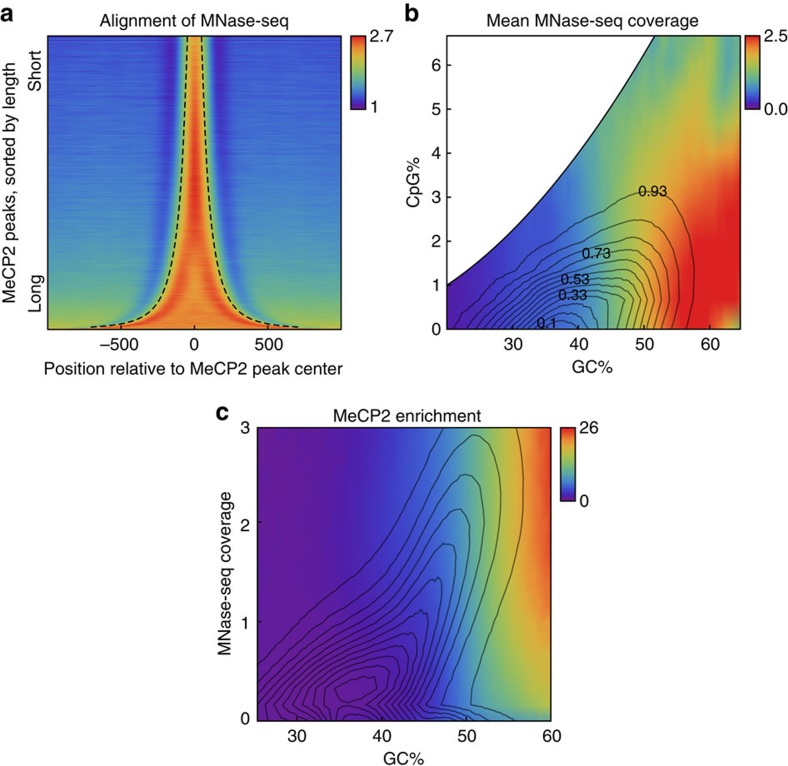
Figure 4. MeCP2 binding coincides with nucleosomes.
(a) Enrichment plot of WT MNase-seq profile (colour) around MeCP2 ChIP-seq peaks (sorted by length and outlined by dashed curves). (b) GC% and CpG% dependence of the mean WT MNase-seq coverage (colours). The contours indicate the genome-wide joint distribution p(GC%, CpG%). (c) MeCP2 enrichment as a function of GC% and MNase-seq fragment coverage. The contours indicate the genome-wide joint distribution p(GC%,MNase-seq).

