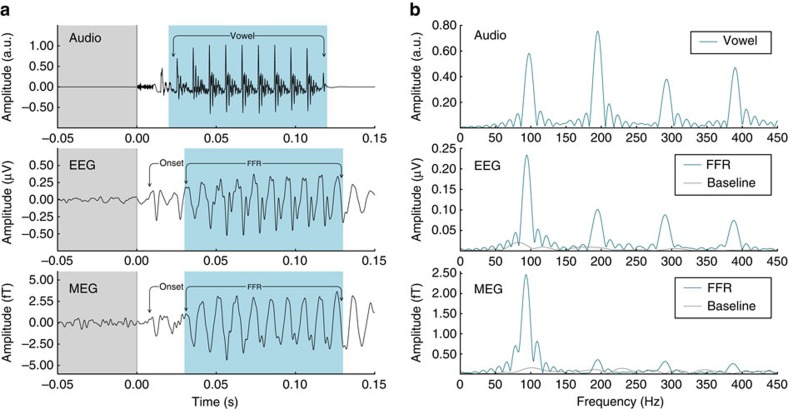
Figure 1. Audio trace, EEG–ABR and single-channel MEG–ABR grand averages. A single MEG channel was selected by maximum correlation with the EEG channel.
(a) Time course of speech stimulus (syllable: /da/) and EEG/MEG responses, showing that the onset response and the FFR commonly studied with EEG are preserved in the single-channel MEG–ABR. The prestimulus baseline (−50 to 0 ms) and the frequency-following response (FFR) periods (30 to 130 ms) are marked in grey and blue, respectively, for the EEG and MEG responses. (b) Corresponding spectra of the periodic portion of the audio signal and the FFR of the responses are shown in blue. Baseline spectra are in grey (n=20).

